Hookito

The Hookito atlas

More world maps: food, nature, culture, flags and energy

All world maps →

Discover food supply, forests and rainfall, national animals, monarchies, country name origins, flag maps, painting and book collections, and electricity.

About these maps

The collection brings together data Hookito already uses: the capitals and facts behind the country pages, the outlines from the countries list, the paintings in Art, the album lists in Audio and the night side of the globe. The boundaries combine Eurostat GISCO and Natural Earth data. The world maps use a plain equirectangular projection, cropped at 84° north and 58° south; the continent and Europe maps are zoomed from more detailed boundaries.

Spotted a mistake? Write to submissions@hookito.com.

7 maps

Food

What is available to eat and drink per person: fruit, vegetables, meat, fish, milk, calories and alcohol.

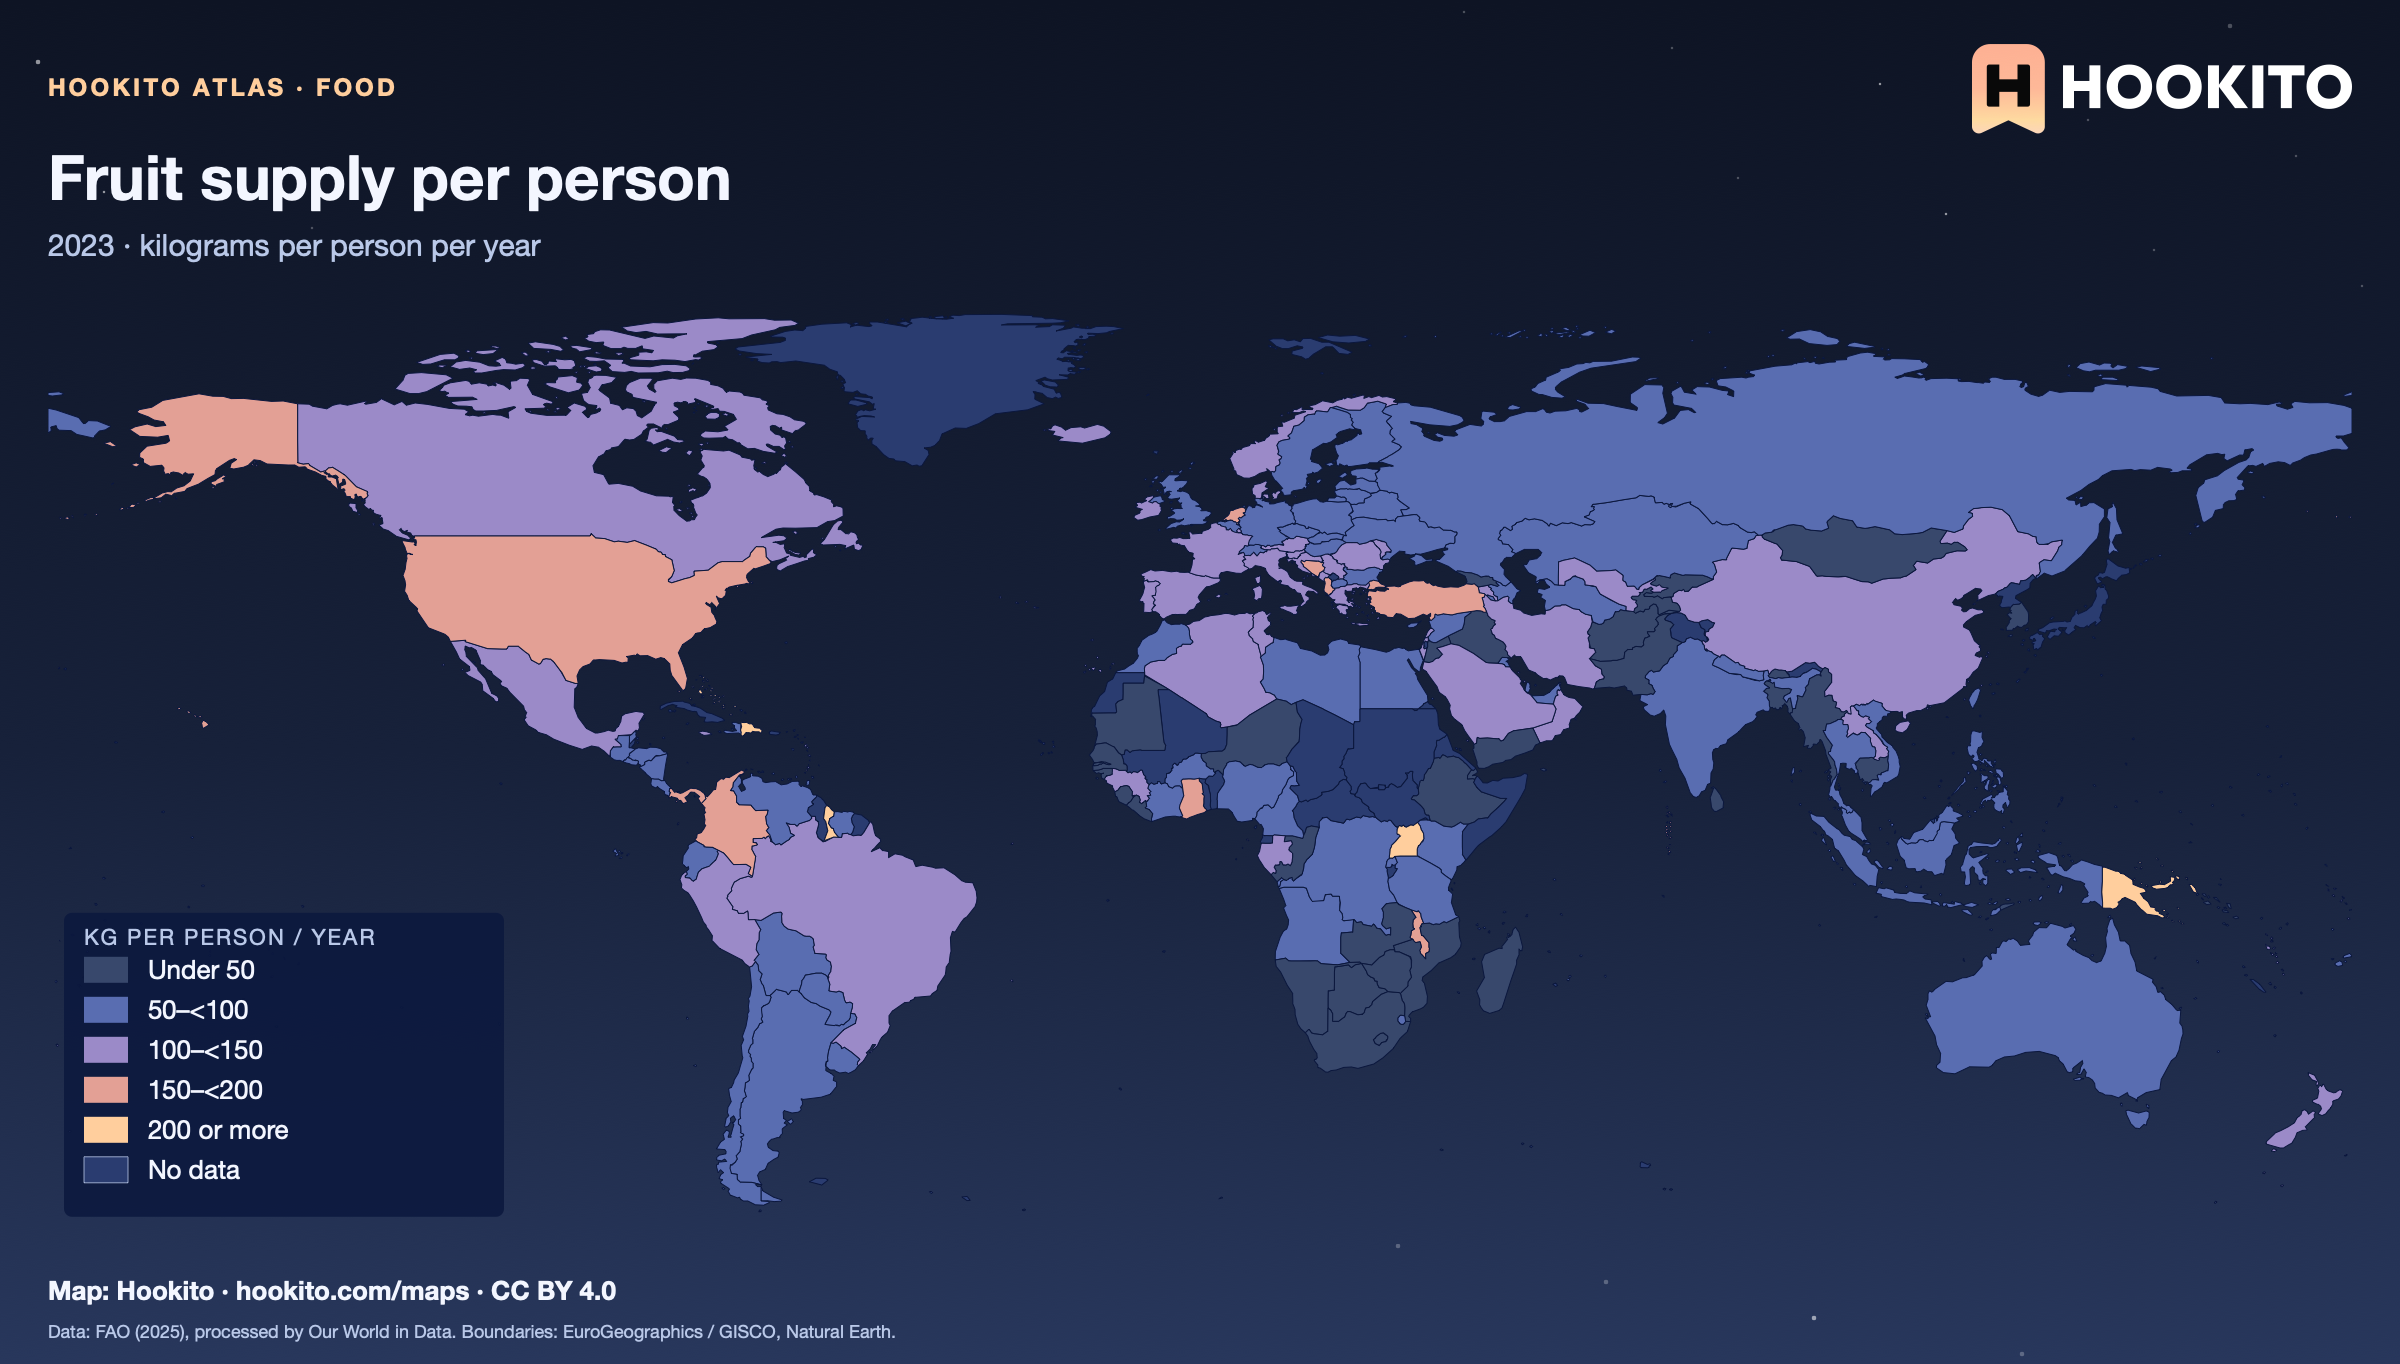
Fruit supply per person
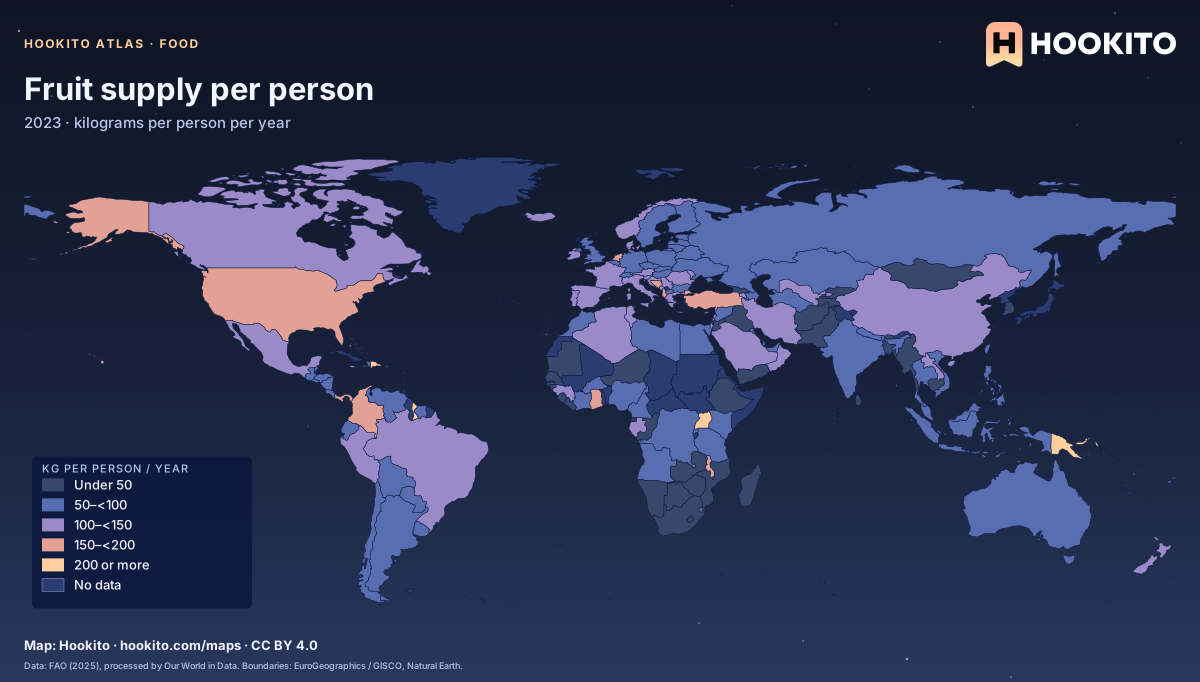
Fruit supply per person, world map with five colour bands and missing data.

Food available for consumption, not actual intake; consumer waste is not deducted. Grey-blue indicates no data. Source details and reuse terms: https://ourworldindata.org/grapher/fruit-consumption-per-capita.

Embed this map

Data: Food and Agriculture Organization of the United Nations (2025), via Our World in Data (https://ourworldindata.org/grapher/fruit-consumption-per-capita). Administrative boundaries © EuroGeographics (Eurostat GISCO). Additional boundaries: Natural Earth (public domain). Source data and citation ↗
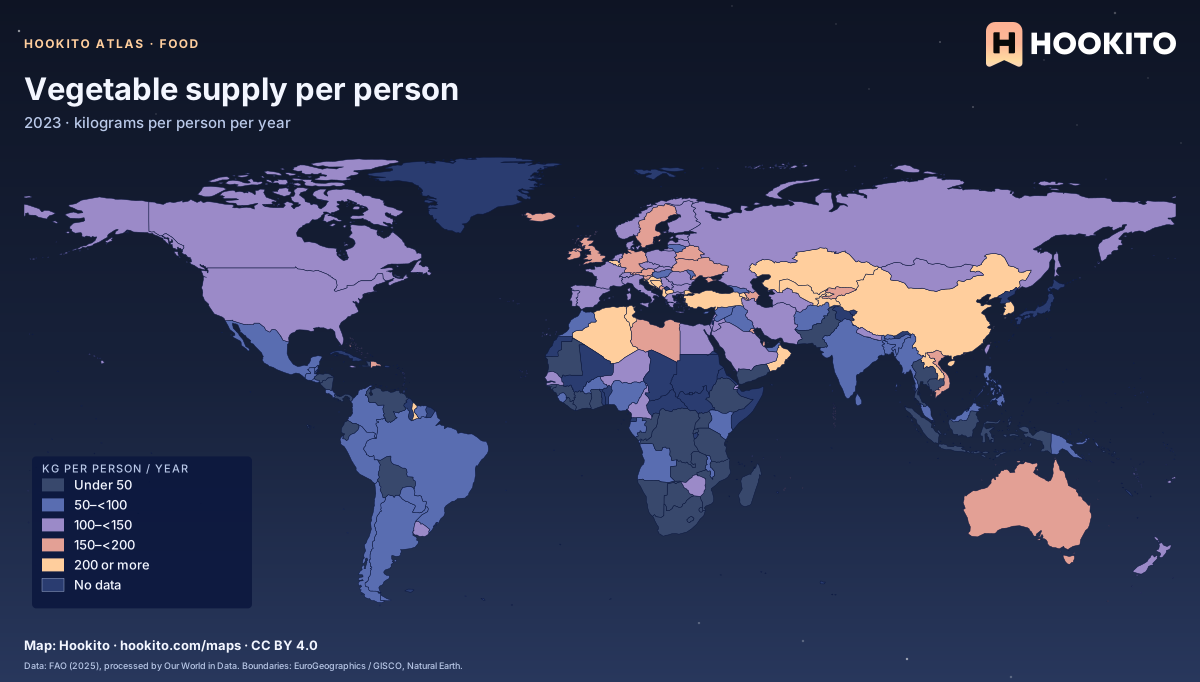
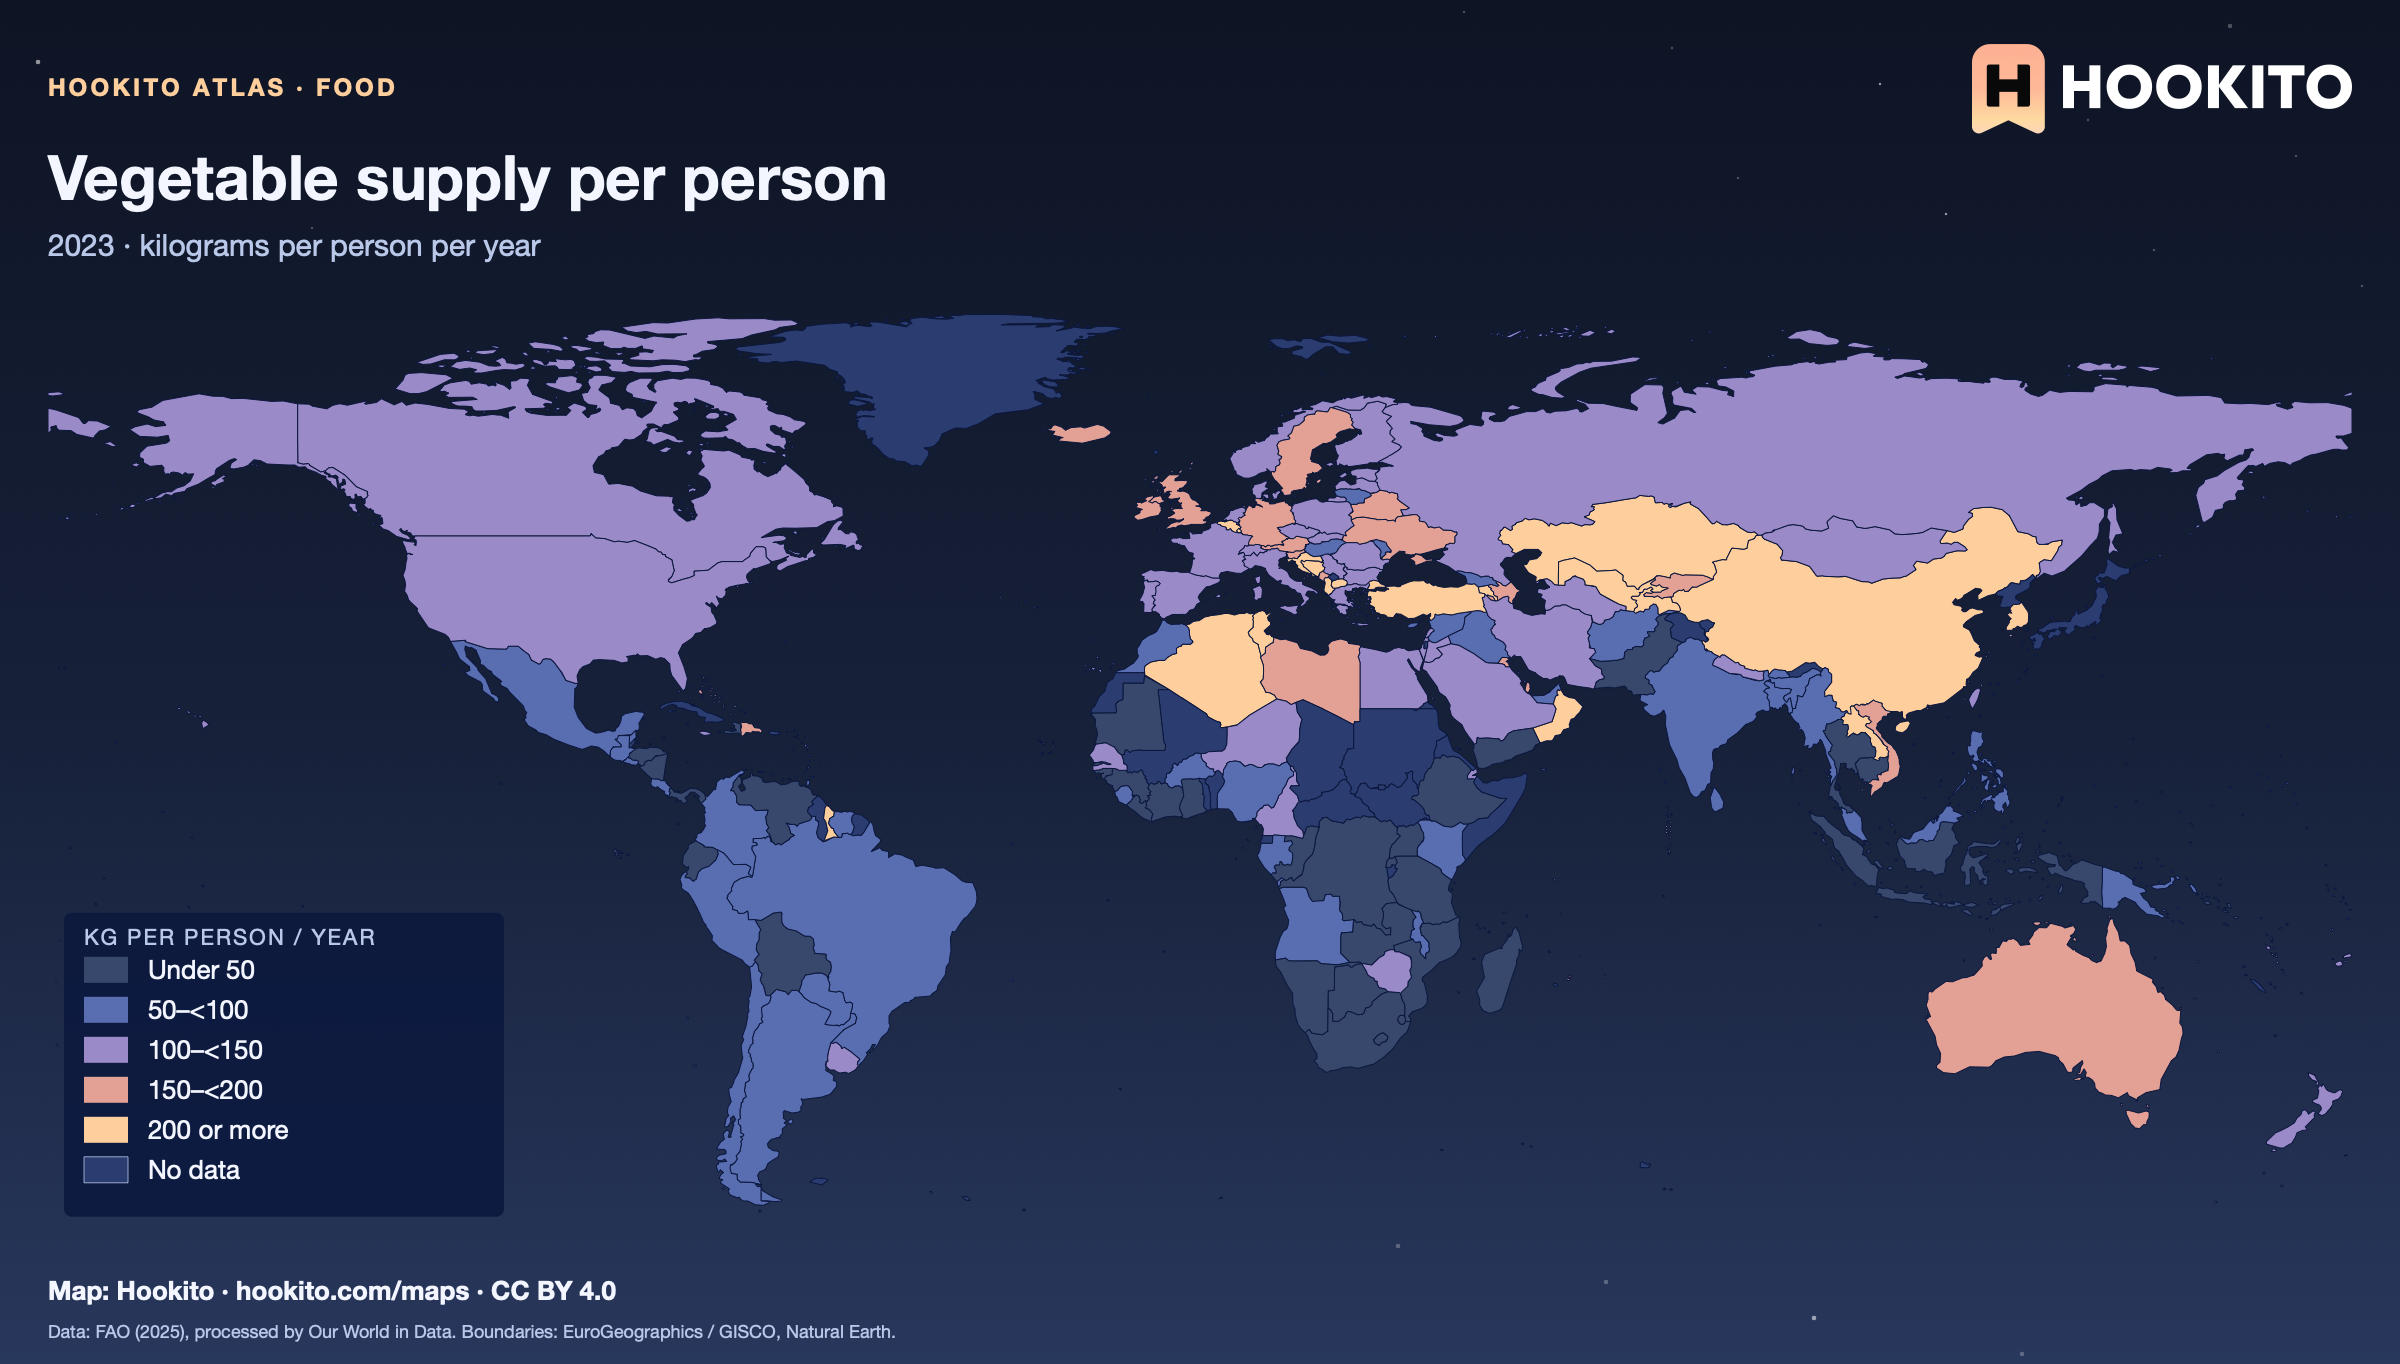
Vegetable supply per person

Vegetable supply per person, world map with five colour bands and missing data.

Food available for consumption, not actual intake; consumer waste is not deducted. Grey-blue indicates no data. Source details and reuse terms: https://ourworldindata.org/grapher/vegetable-consumption-per-capita.

Embed this map

Data: Food and Agriculture Organization of the United Nations (2025), via Our World in Data (https://ourworldindata.org/grapher/vegetable-consumption-per-capita). Administrative boundaries © EuroGeographics (Eurostat GISCO). Additional boundaries: Natural Earth (public domain). Source data and citation ↗
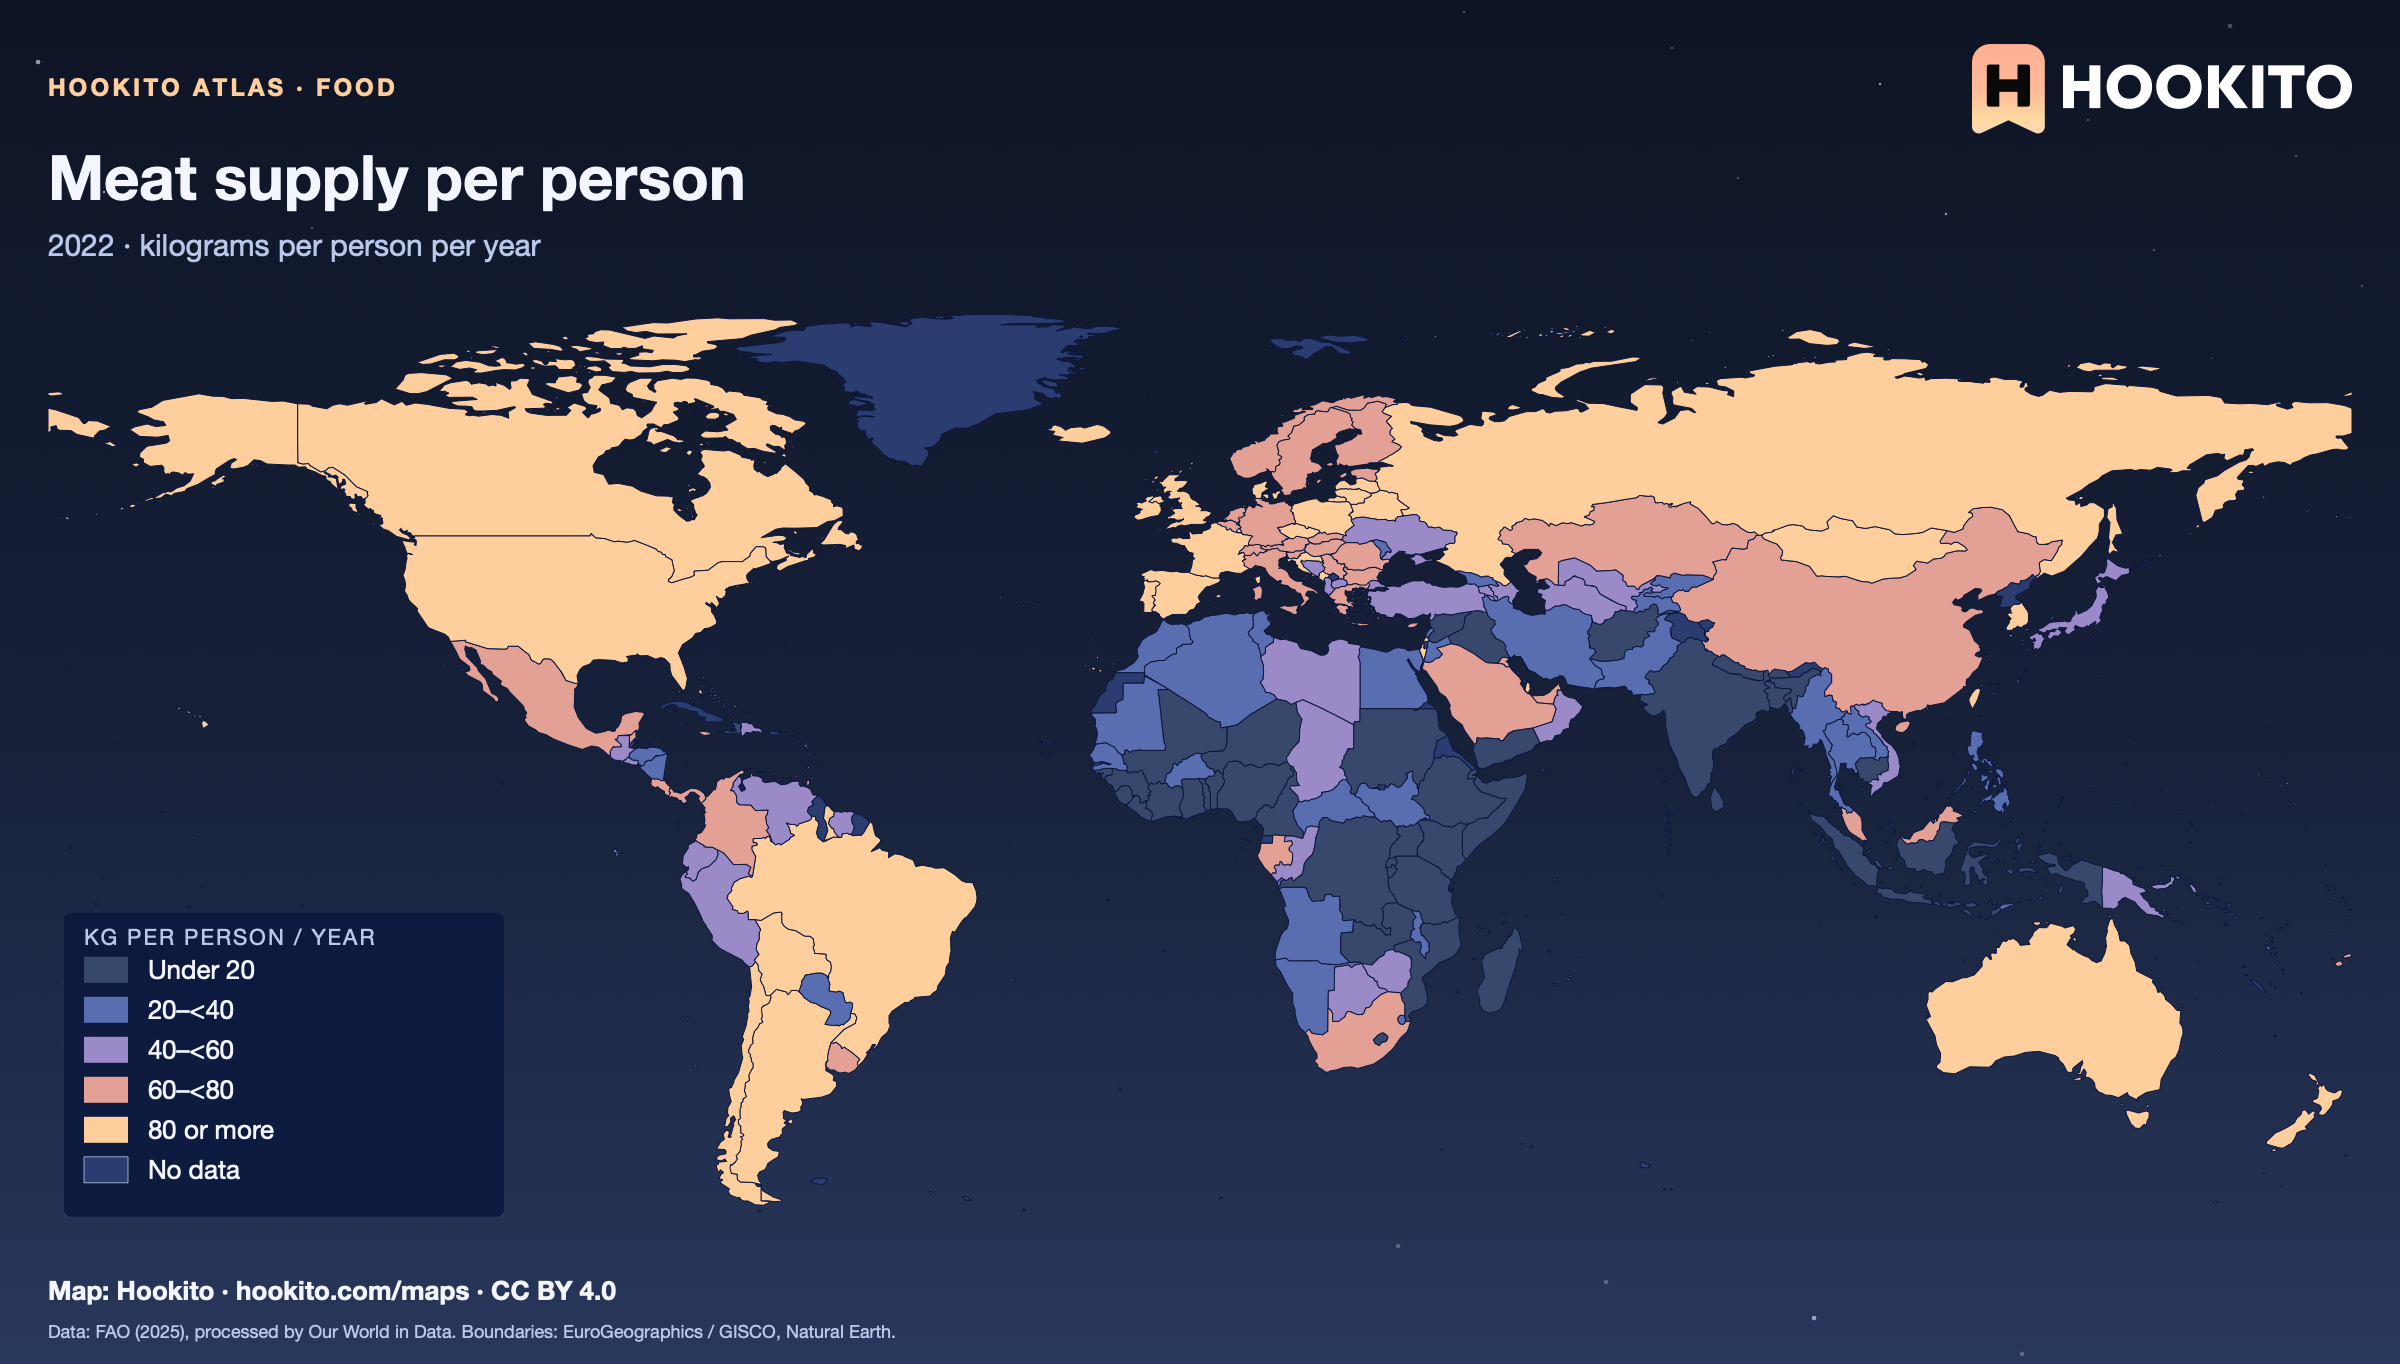
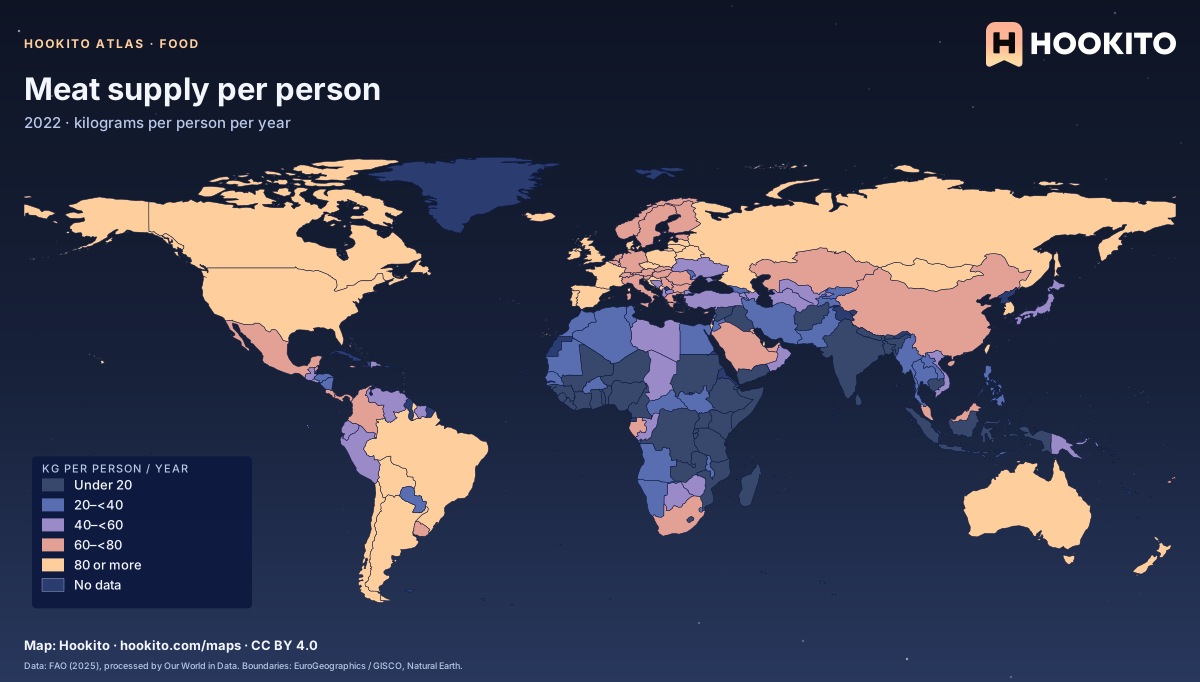
Meat supply per person

Meat supply per person, world map with five colour bands and missing data.

Food available for consumption, not actual intake; consumer waste is not deducted. Figures are for 2022 because the 2023 data lacks several countries. Grey-blue indicates no data. Source details and reuse terms: https://ourworldindata.org/grapher/meat-supply-per-person.

Embed this map

Data: Food and Agriculture Organization of the United Nations (2025), via Our World in Data (https://ourworldindata.org/grapher/meat-supply-per-person). Administrative boundaries © EuroGeographics (Eurostat GISCO). Additional boundaries: Natural Earth (public domain). Source data and citation ↗
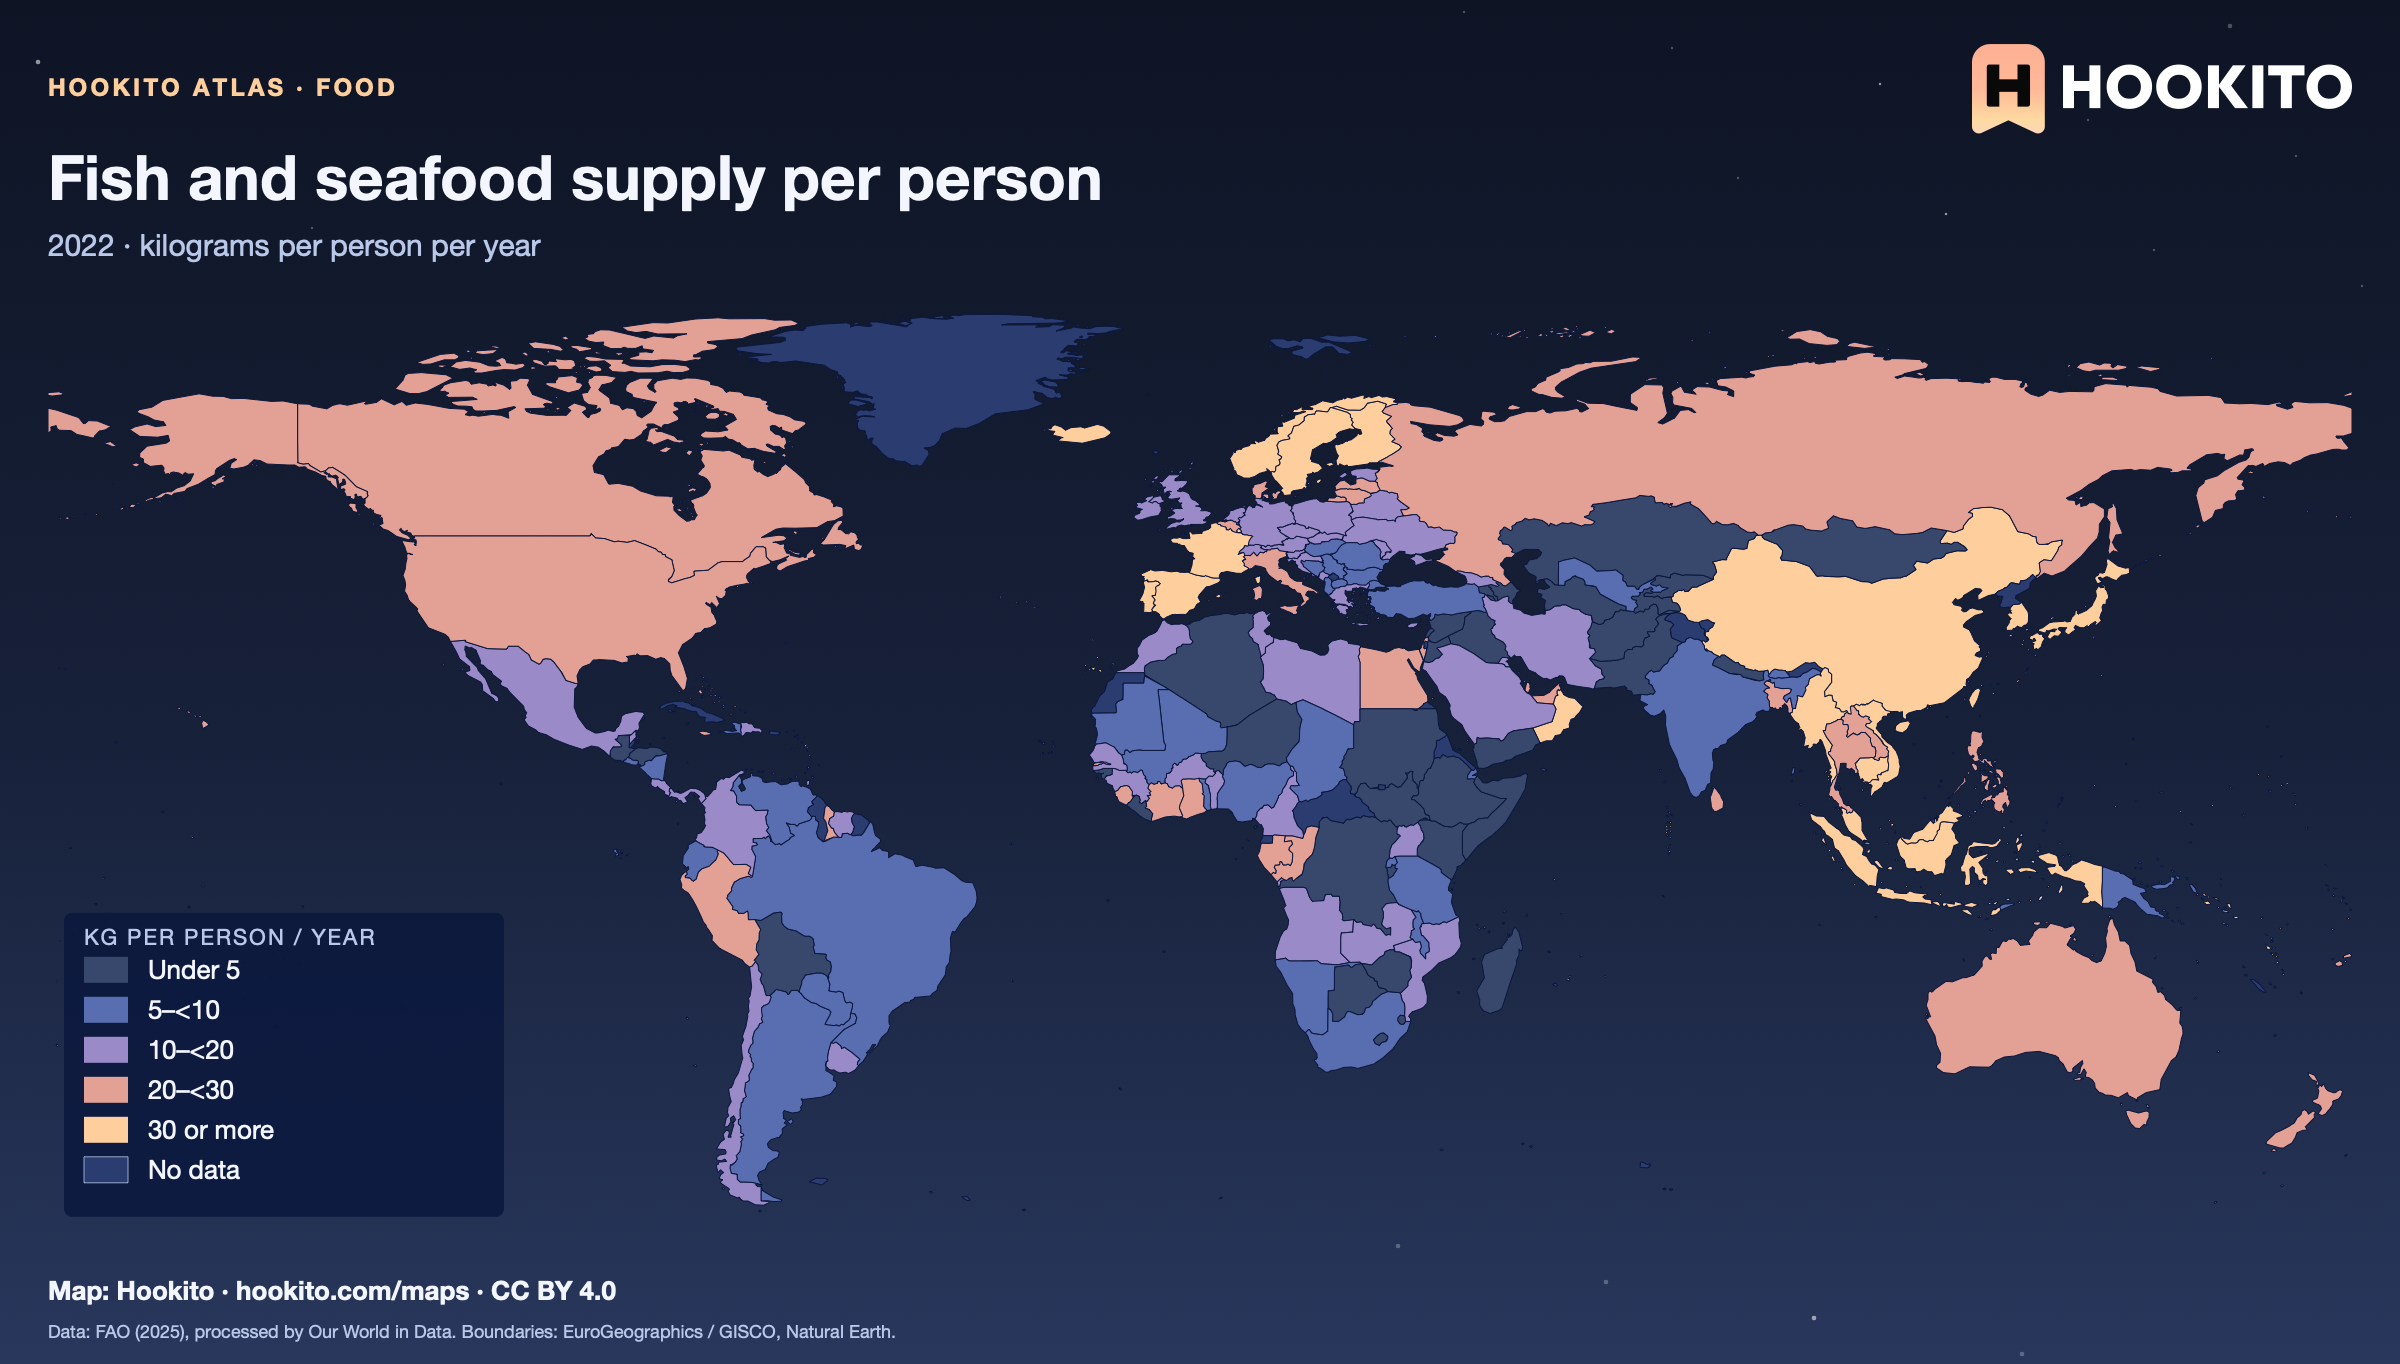
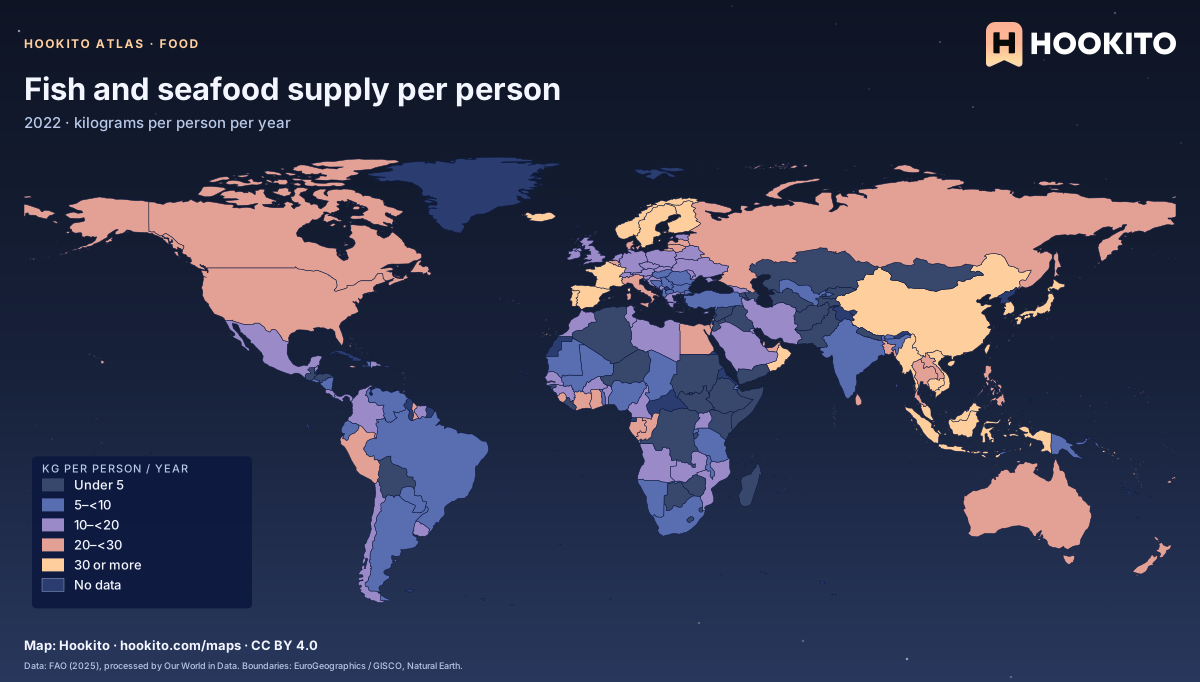
Fish and seafood supply per person

Fish and seafood supply per person, world map with five colour bands and missing data.

Covers all fish species and major seafood such as crustaceans and molluscs. Food available for consumption, not actual intake; consumer waste is not deducted. Figures are for 2022 because the 2023 data lacks several countries. Grey-blue indicates no data. Source details and reuse terms: https://ourworldindata.org/grapher/fish-and-seafood-consumption-per-capita.

Embed this map

Data: Food and Agriculture Organization of the United Nations (2025), via Our World in Data (https://ourworldindata.org/grapher/fish-and-seafood-consumption-per-capita). Administrative boundaries © EuroGeographics (Eurostat GISCO). Additional boundaries: Natural Earth (public domain). Source data and citation ↗
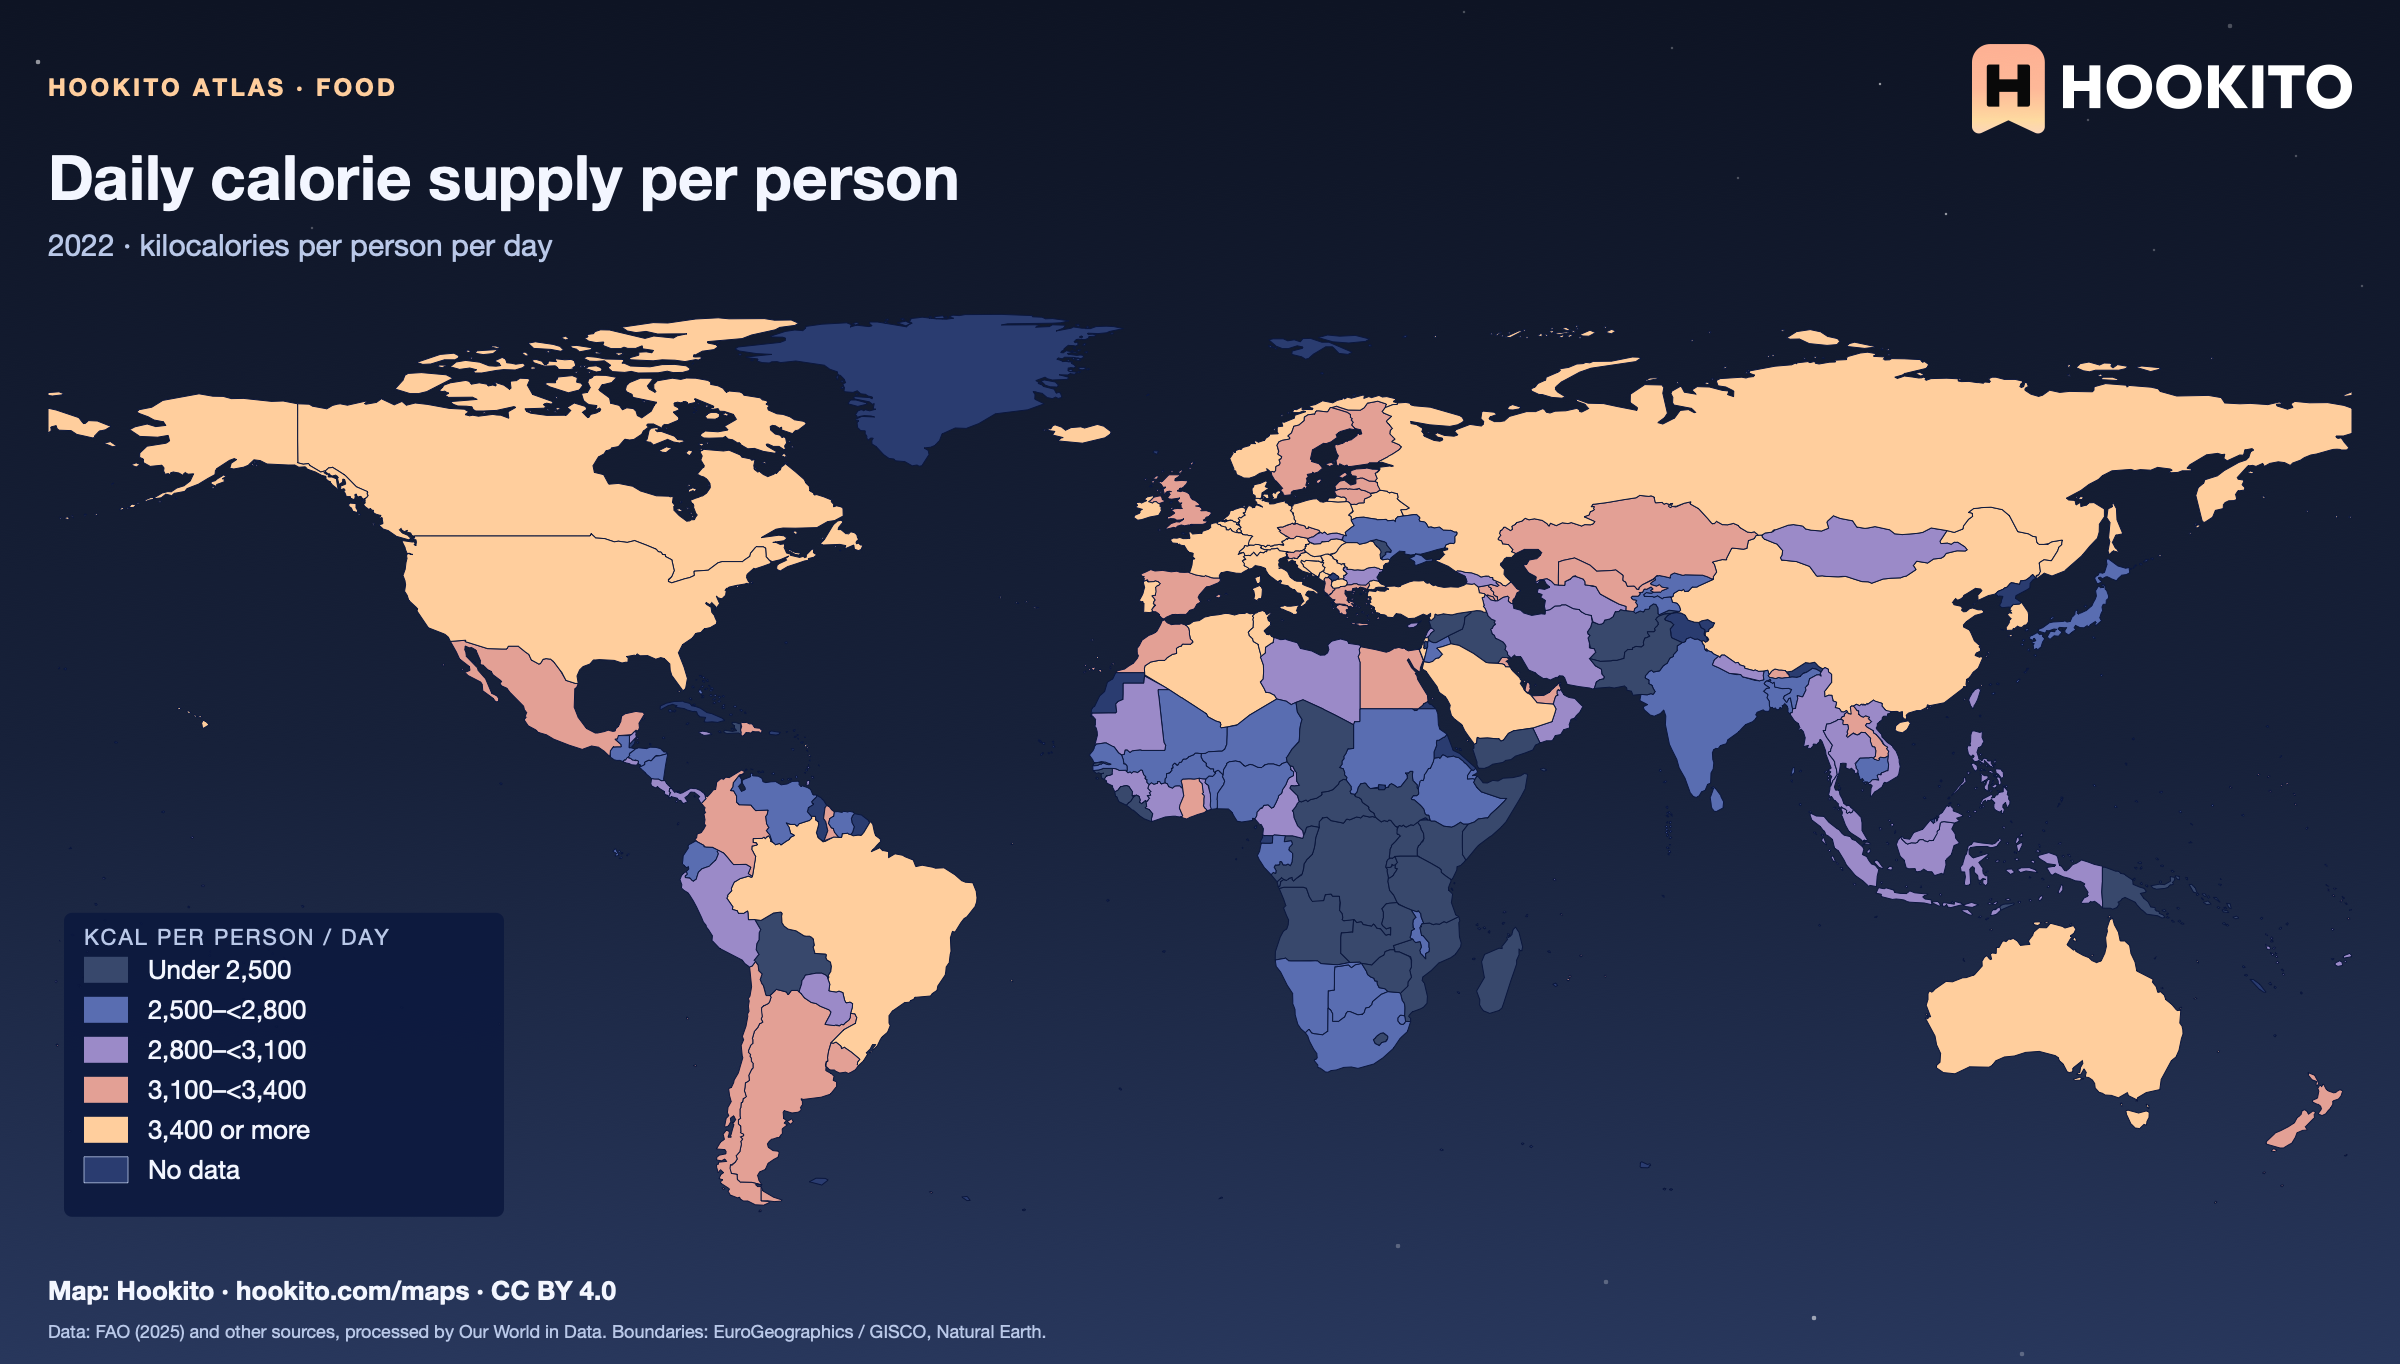
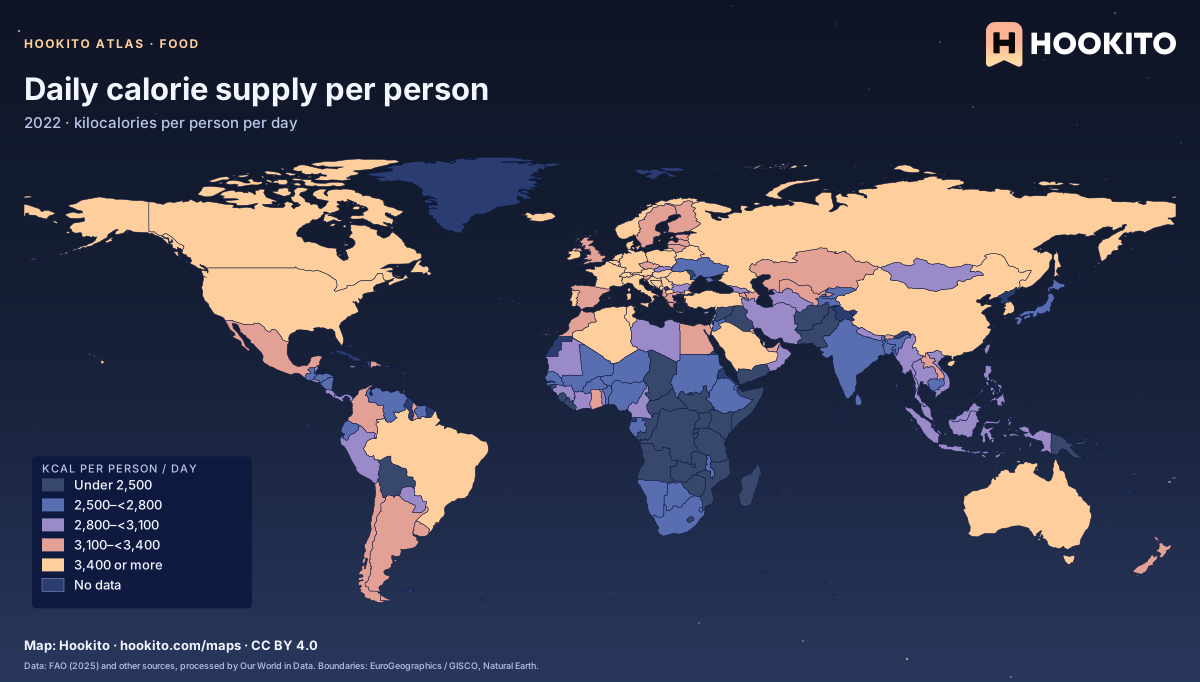
Daily calorie supply per person

Daily calorie supply per person, world map with five colour bands and missing data.

Food available for consumption, not actual intake; consumer waste is not deducted. Figures are for 2022 because the 2023 data lacks several countries. Grey-blue indicates no data. Source details and reuse terms: https://ourworldindata.org/grapher/daily-per-capita-caloric-supply.

Embed this map

Data: Food and Agriculture Organization of the United Nations (2025) and other sources, via Our World in Data (https://ourworldindata.org/grapher/daily-per-capita-caloric-supply). Administrative boundaries © EuroGeographics (Eurostat GISCO). Additional boundaries: Natural Earth (public domain). Source data and citation ↗
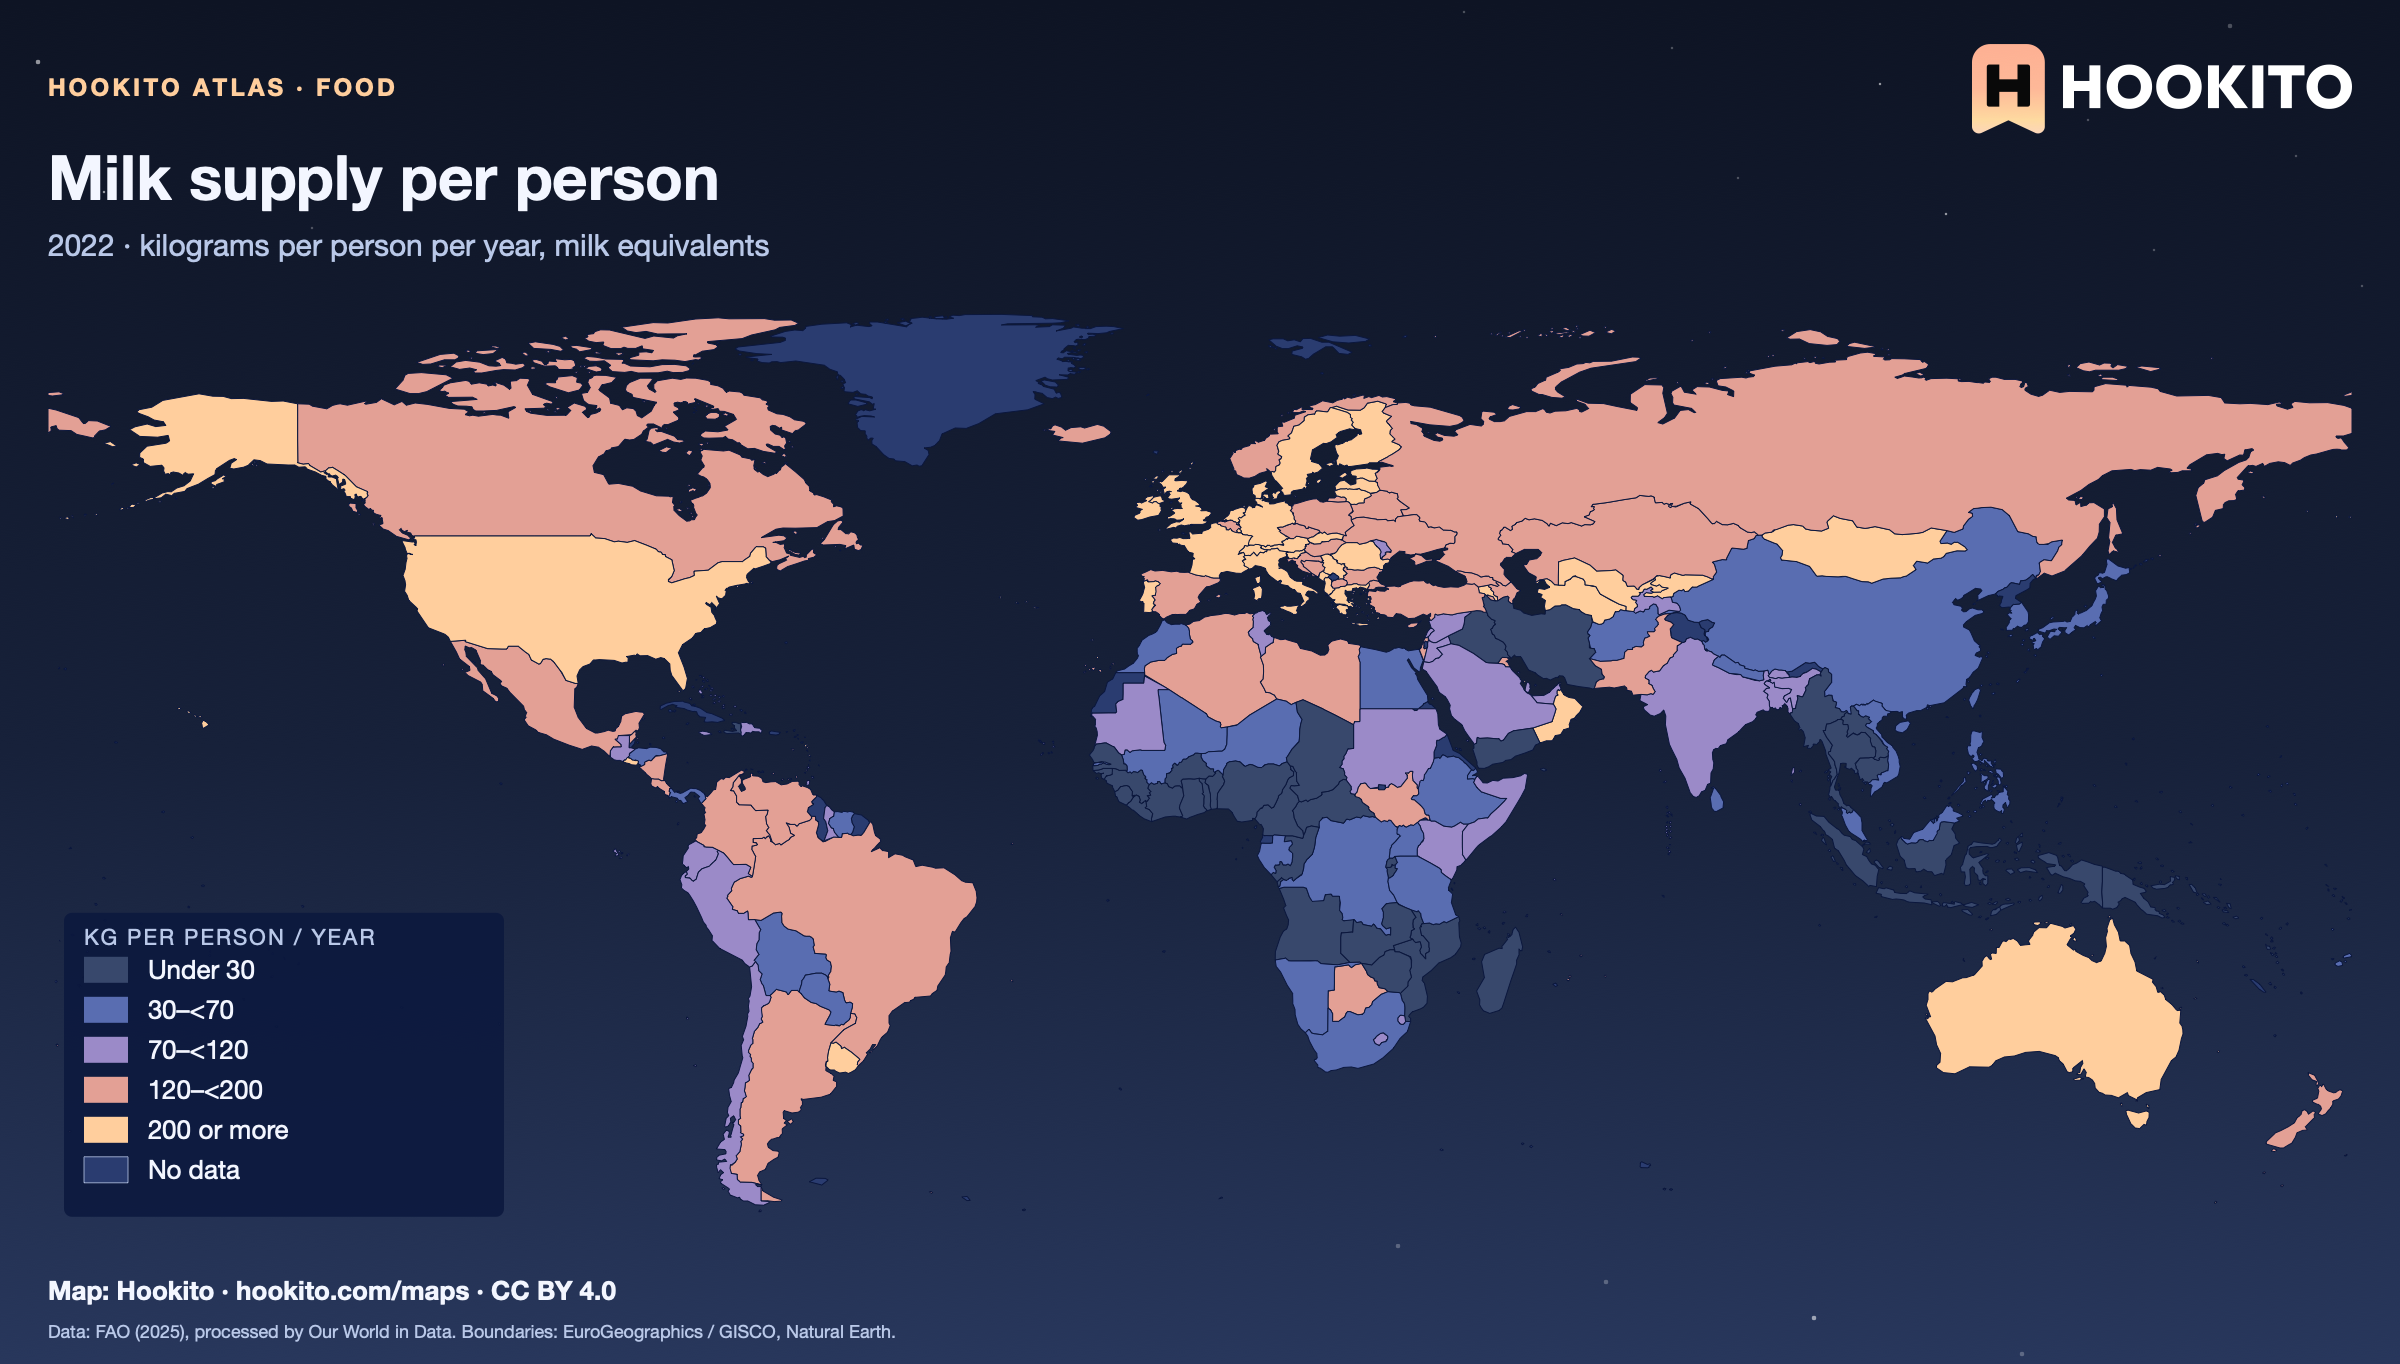
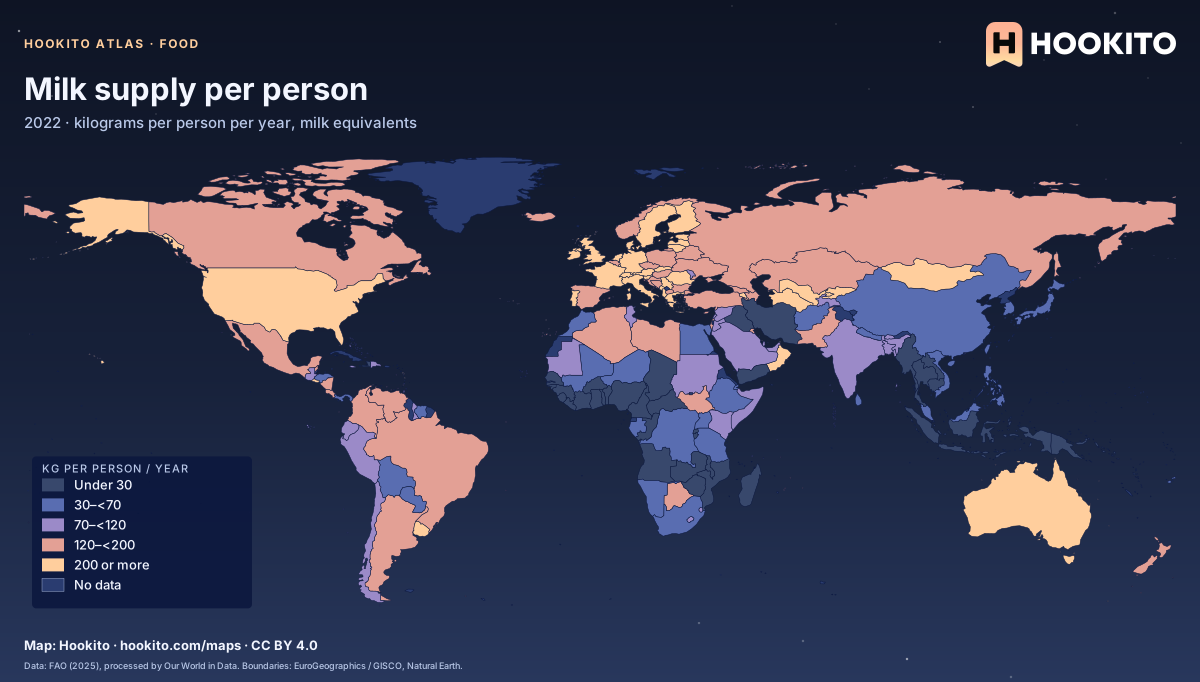
Milk supply per person

Milk supply per person, world map with five colour bands and missing data.

Includes the milk equivalents of dairy products but excludes butter. Food available for consumption, not actual intake; consumer waste is not deducted. Figures are for 2022 because the 2023 data lacks several countries. Grey-blue indicates no data. Source details and reuse terms: https://ourworldindata.org/grapher/per-capita-milk-consumption.

Embed this map

Data: Food and Agriculture Organization of the United Nations (2025), via Our World in Data (https://ourworldindata.org/grapher/per-capita-milk-consumption). Administrative boundaries © EuroGeographics (Eurostat GISCO). Additional boundaries: Natural Earth (public domain). Source data and citation ↗
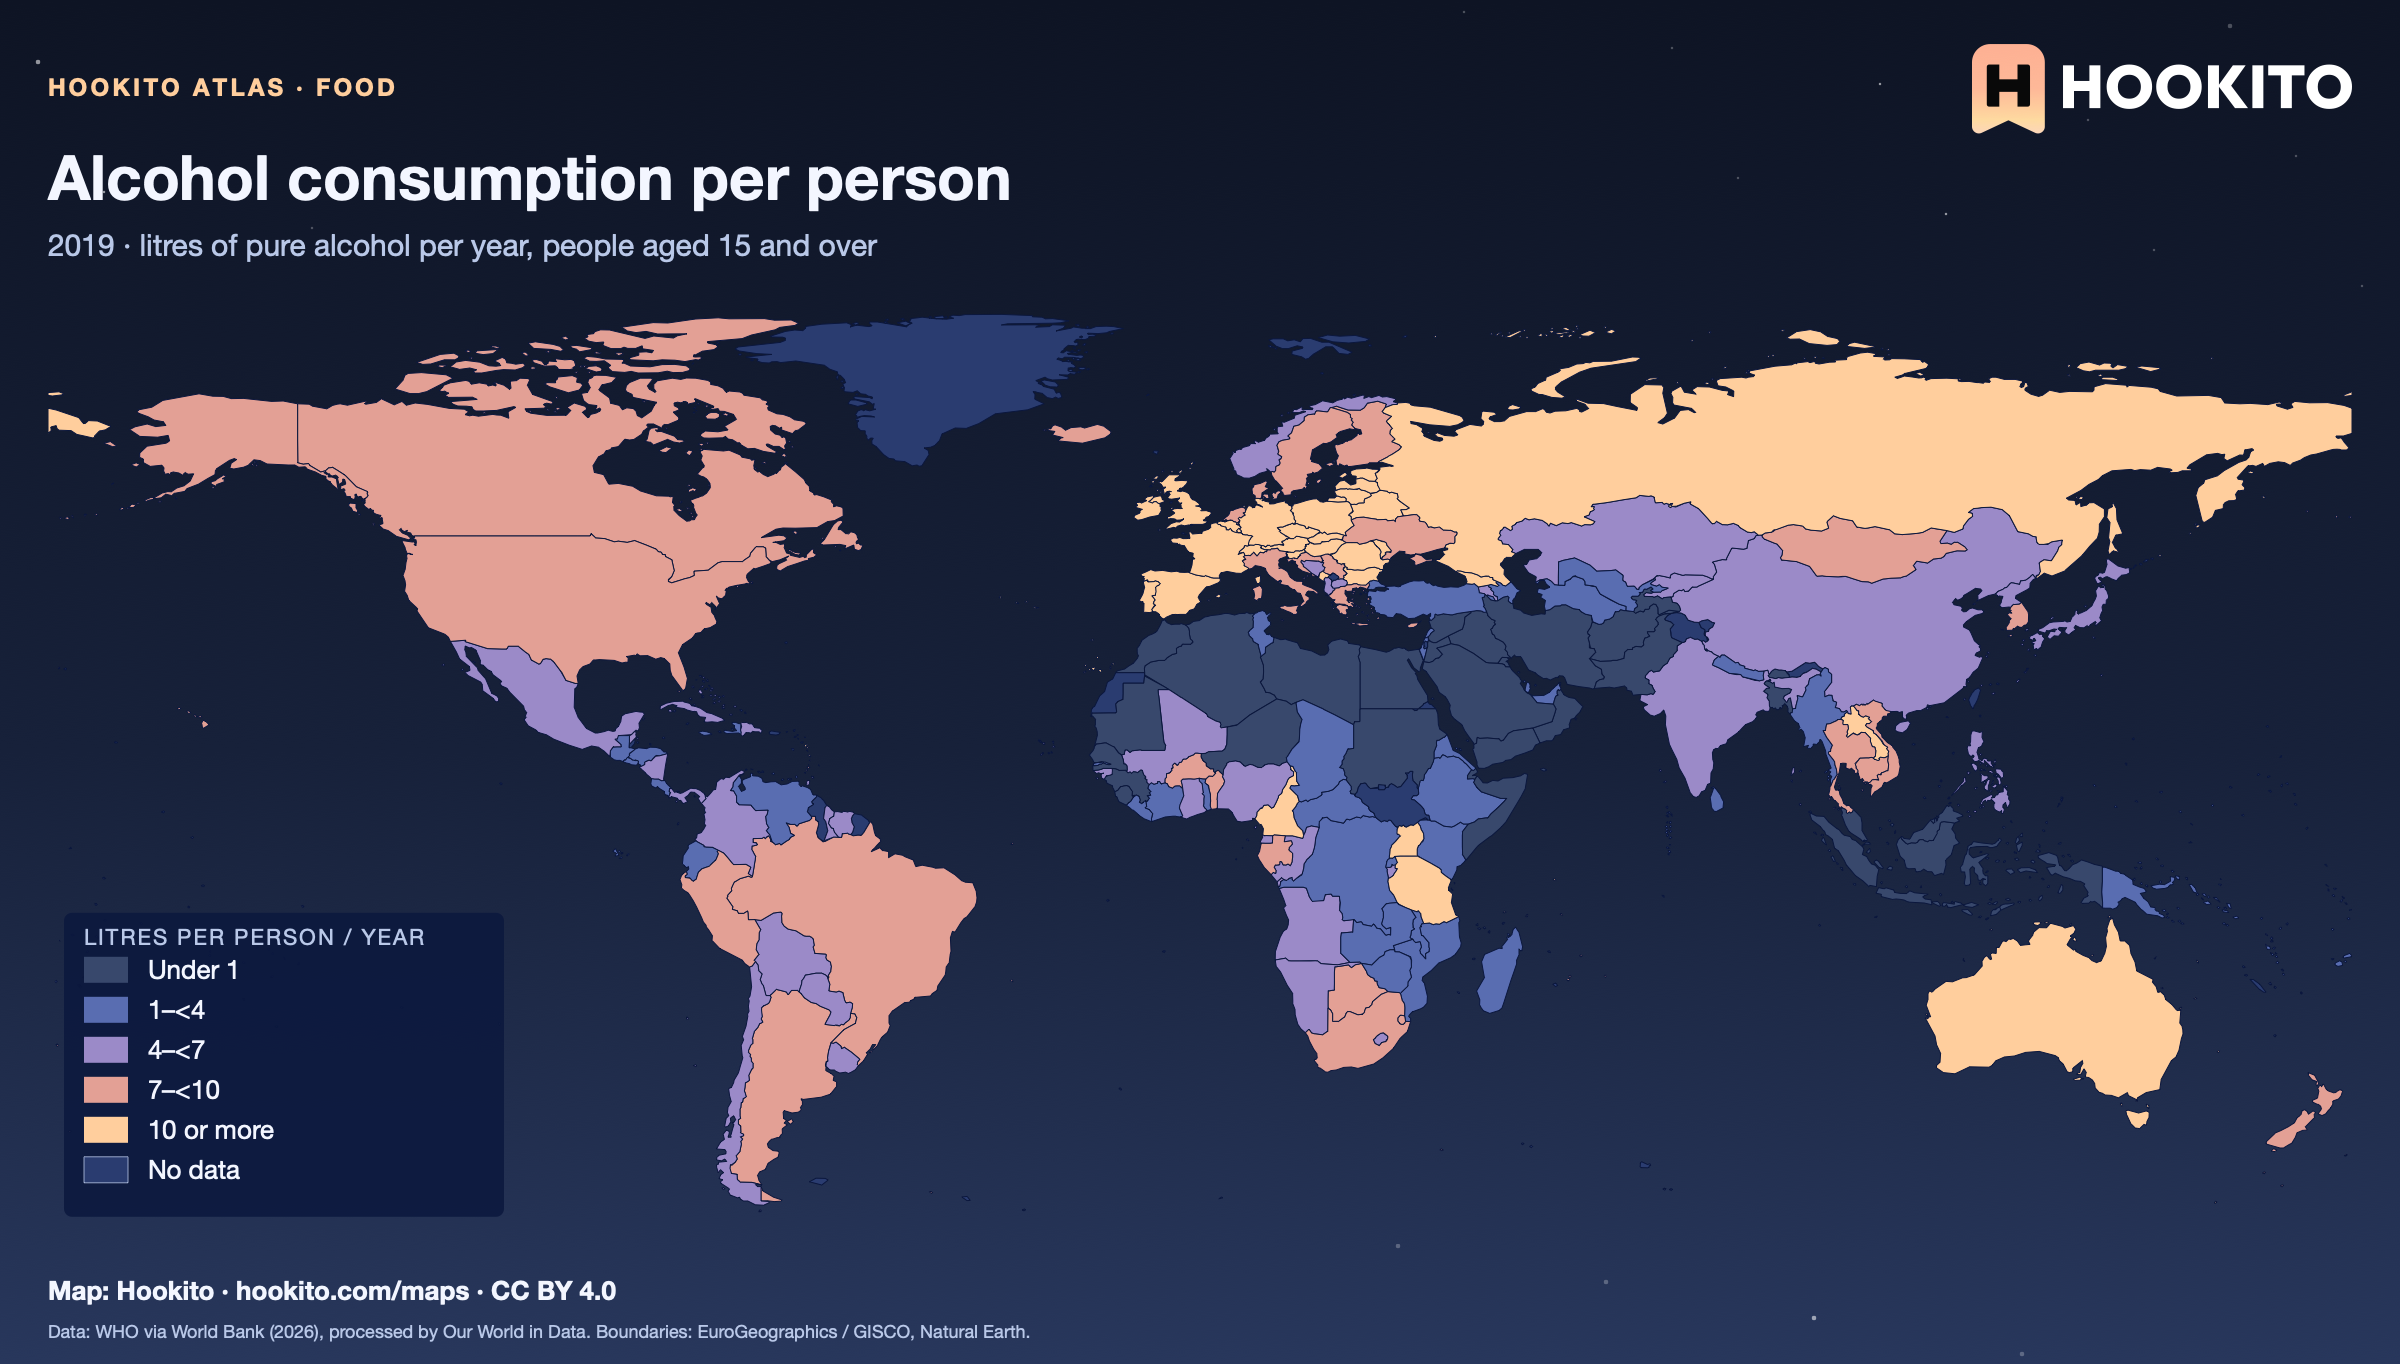
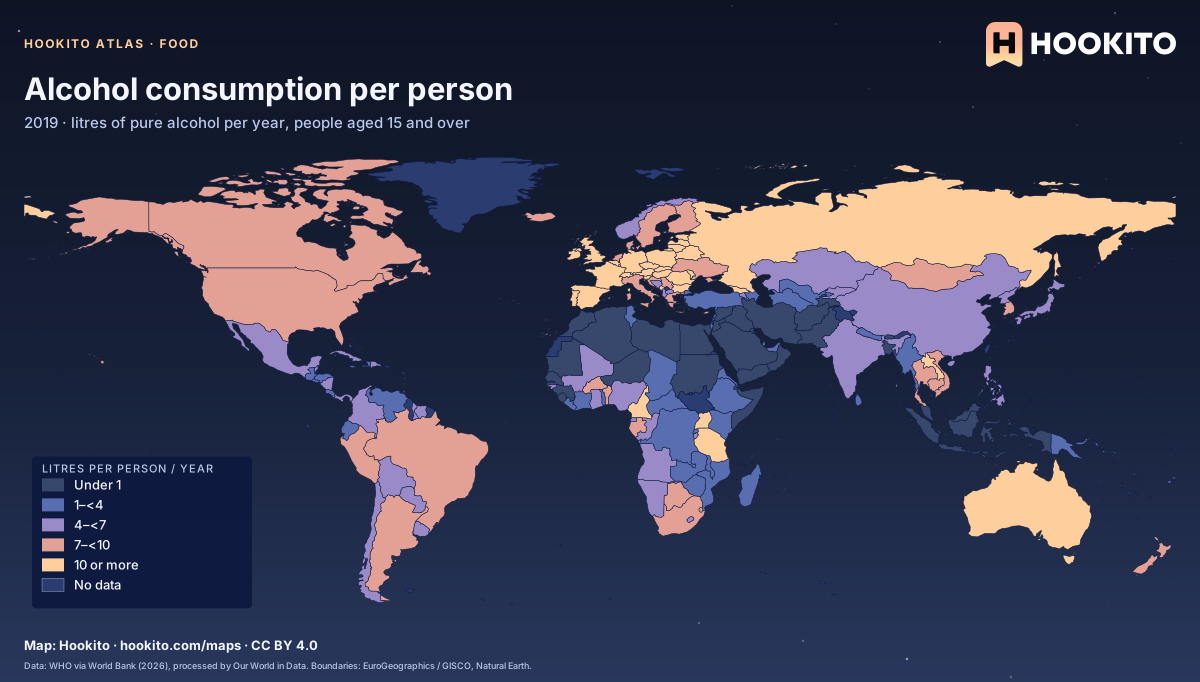
Alcohol consumption per person

Alcohol consumption per person, world map with five colour bands and missing data.

World Health Organization estimates for 2019 of alcohol consumed per person aged 15 and over, in litres of pure alcohol. National averages hide large differences between drinkers and non-drinkers. Grey-blue indicates no data. Source details and reuse terms: https://ourworldindata.org/grapher/total-alcohol-consumption-per-capita-litres-of-pure-alcohol.

Embed this map

Data: Global Health Observatory Data Repository - World Health Organization (WHO), via World Bank (2026), via Our World in Data (https://ourworldindata.org/grapher/total-alcohol-consumption-per-capita-litres-of-pure-alcohol). Administrative boundaries © EuroGeographics (Eurostat GISCO). Additional boundaries: Natural Earth (public domain). Source data and citation ↗
5 maps

Nature & environment

Forests, protected land, rainfall, emissions and national animals.

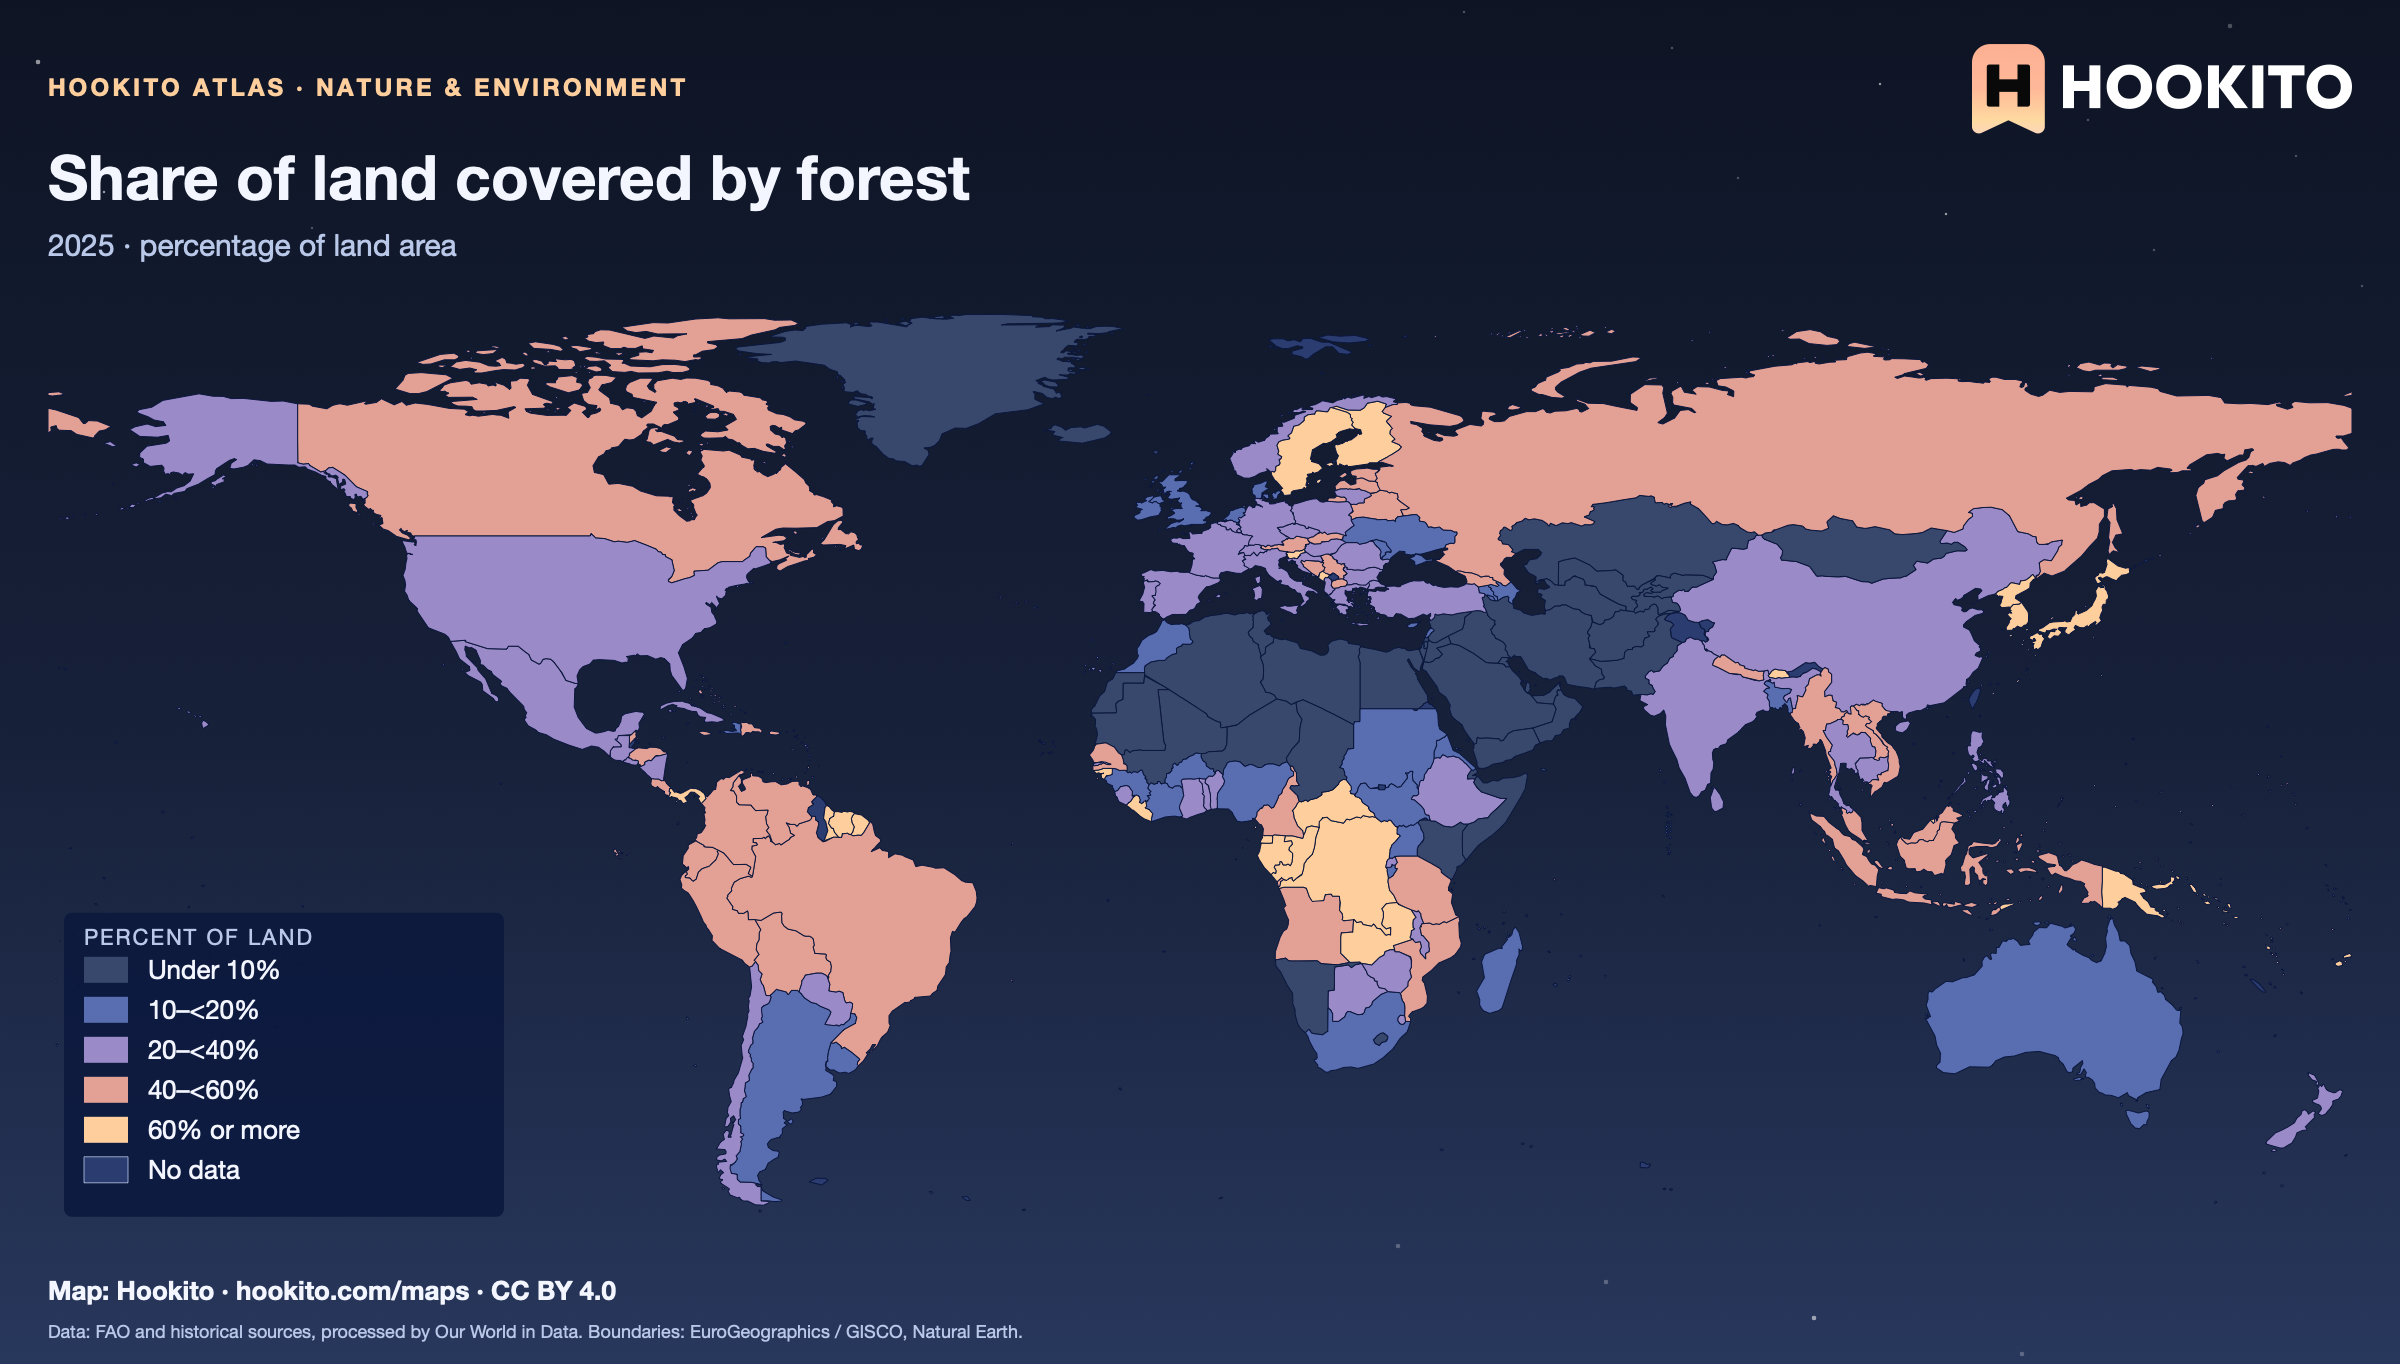
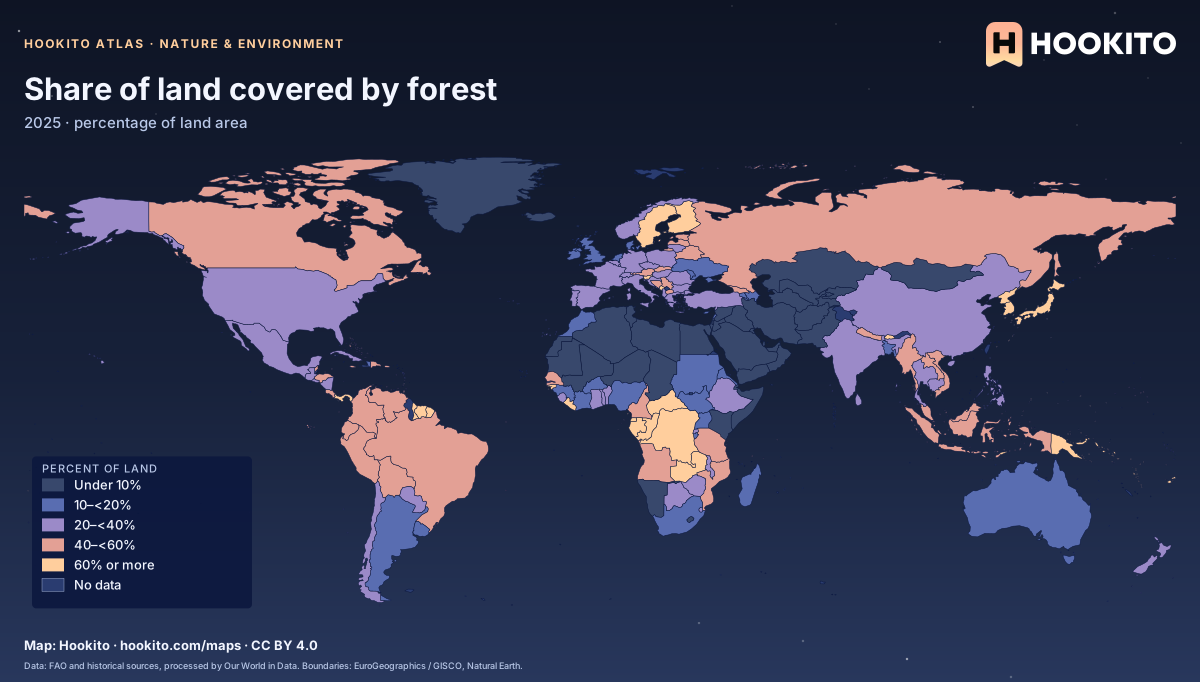
Share of land covered by forest

Share of land covered by forest, world map with five colour bands and missing data.

Forest means land with natural or planted trees at least five metres tall, excluding trees in agricultural systems. Figures use the 2025 reference year of the FAO Forest Resources Assessment. Grey-blue indicates no data. Source details and reuse terms: https://ourworldindata.org/grapher/forest-area-as-share-of-land-area.

Embed this map

Data: Food and Agriculture Organization of the United Nations and historical sources, via Our World in Data (https://ourworldindata.org/grapher/forest-area-as-share-of-land-area). Administrative boundaries © EuroGeographics (Eurostat GISCO). Additional boundaries: Natural Earth (public domain). Source data and citation ↗
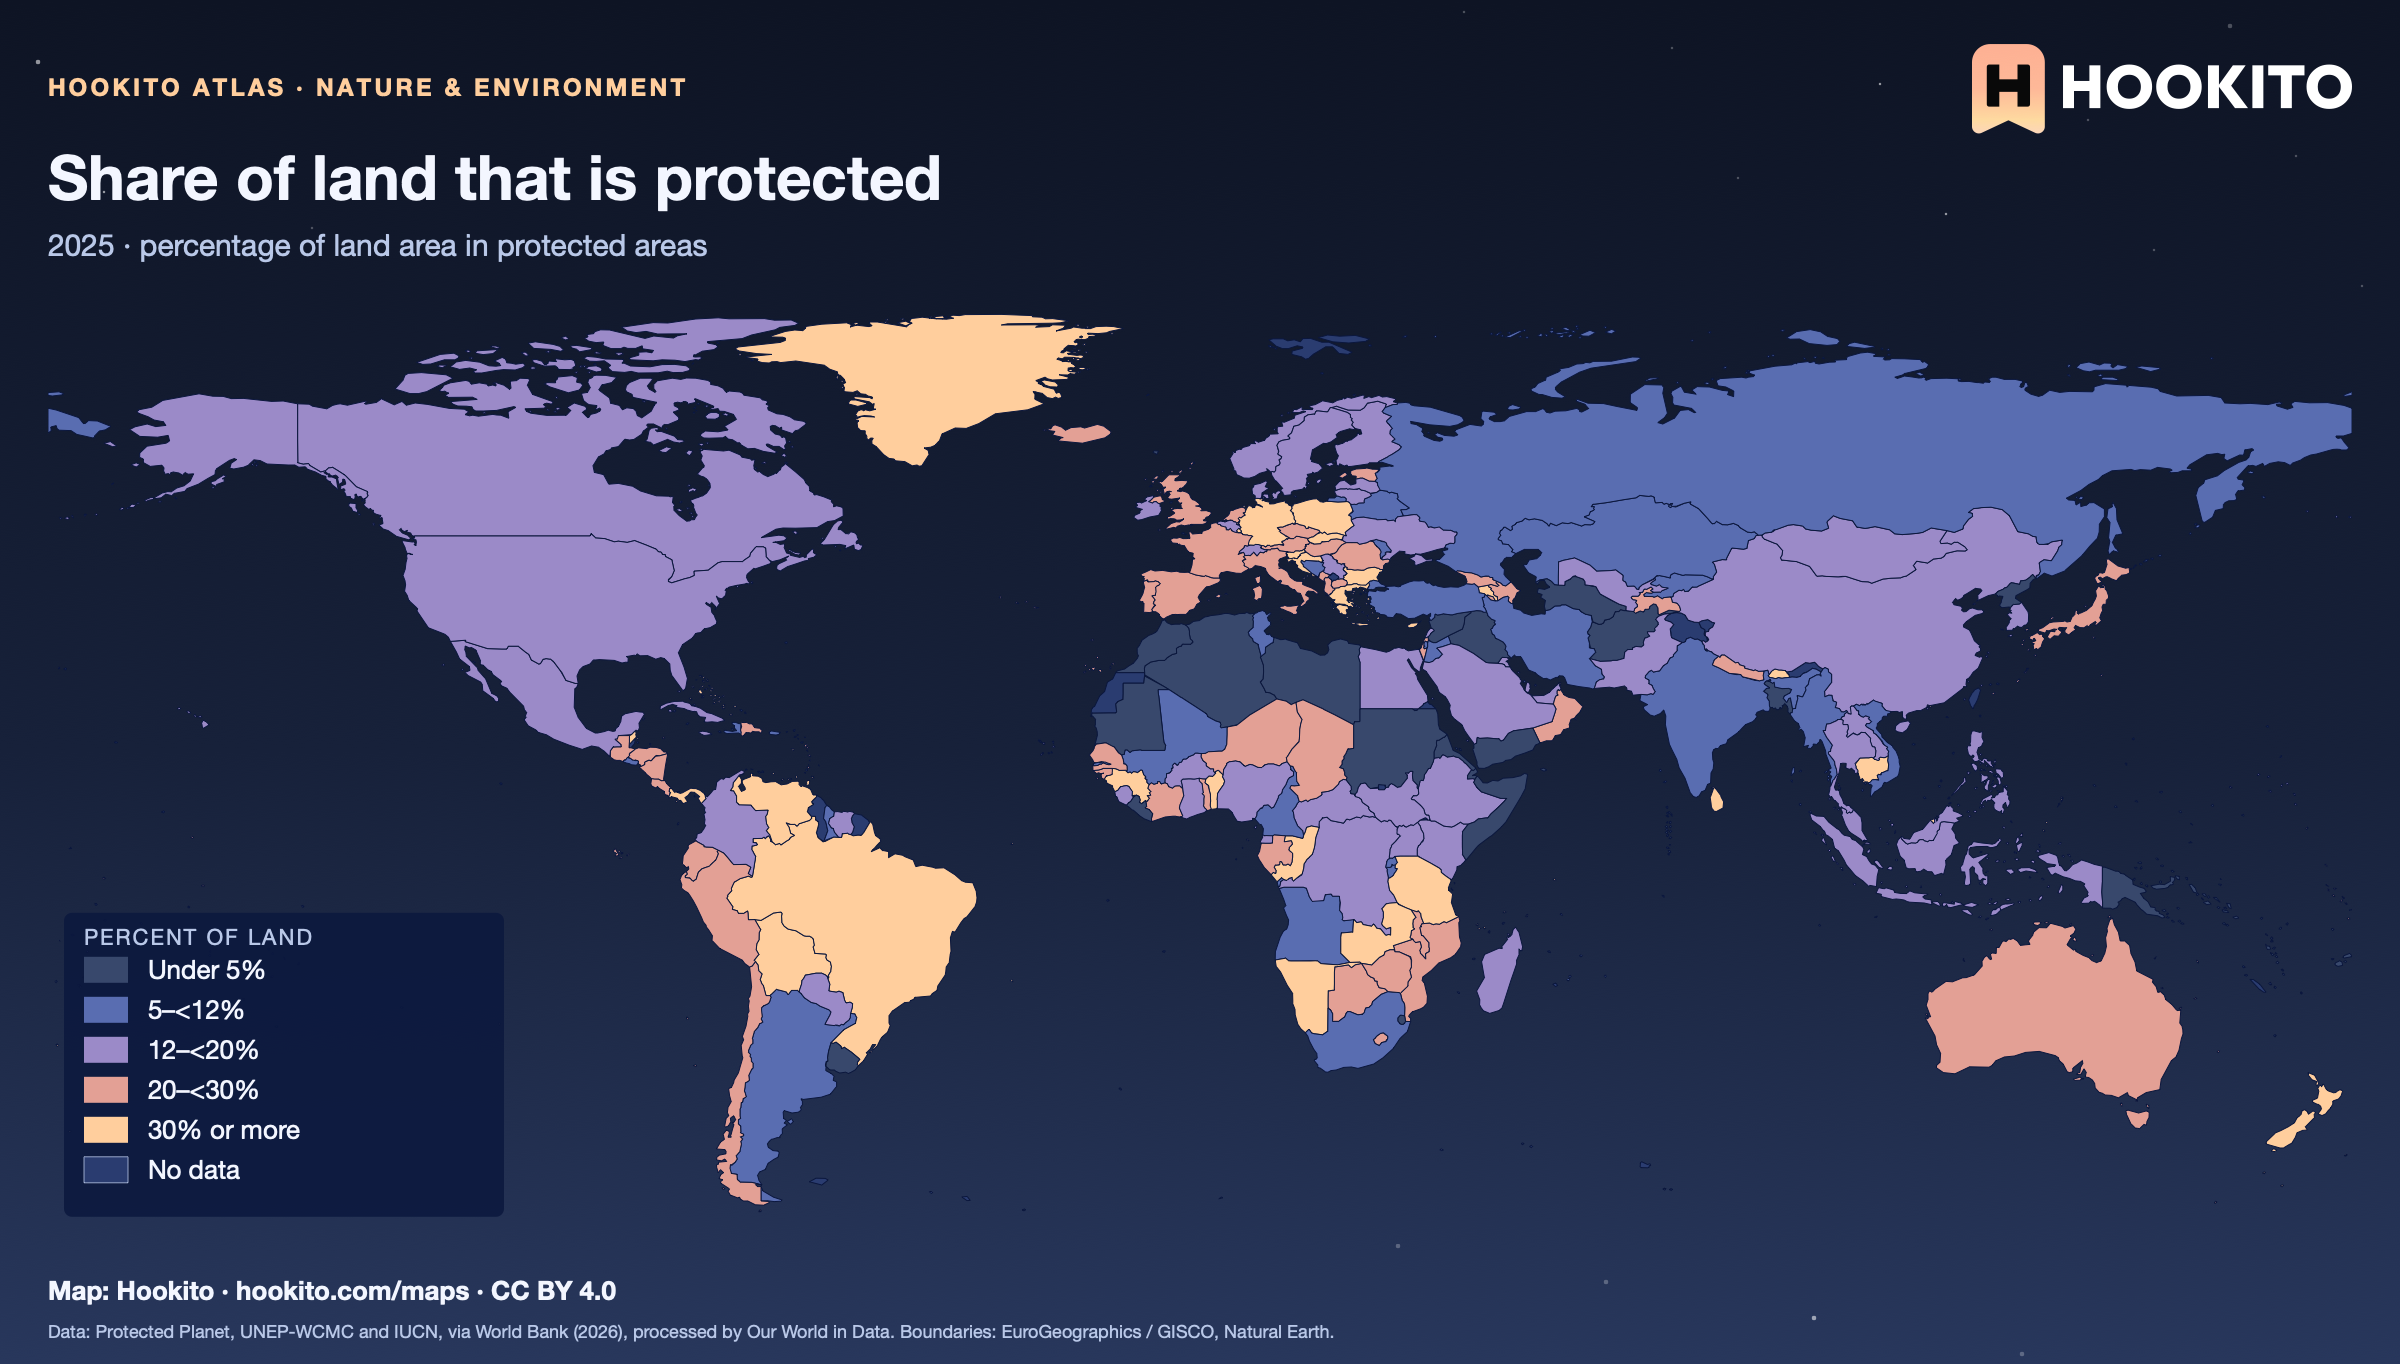
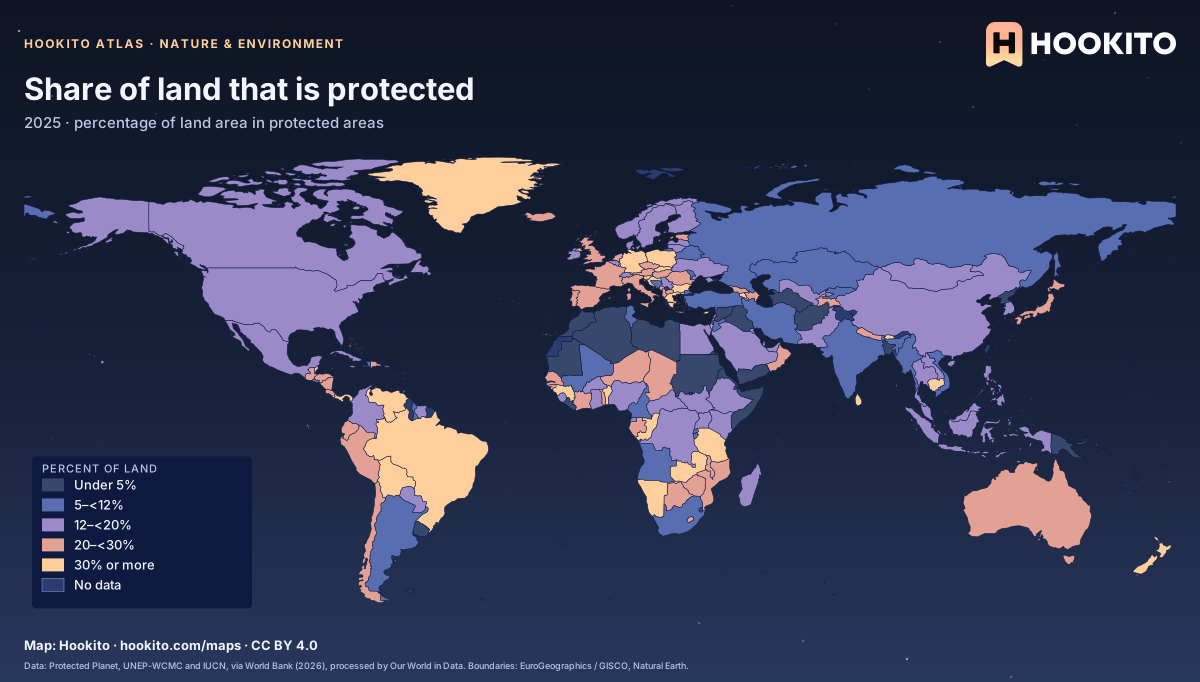
Share of land that is protected

Share of land that is protected, world map with five colour bands and missing data.

Terrestrial protected areas are designated by national authorities to preserve ecosystems and cultural values. Protection shows legal status, not how well the land is managed. Grey-blue indicates no data. Source details and reuse terms: https://ourworldindata.org/grapher/terrestrial-protected-areas.

Embed this map

Data: Protected Planet WDPA and WD-OECM data, UNEP-WCMC and IUCN, via World Bank (2026), via Our World in Data (https://ourworldindata.org/grapher/terrestrial-protected-areas). Administrative boundaries © EuroGeographics (Eurostat GISCO). Additional boundaries: Natural Earth (public domain). Source data and citation ↗
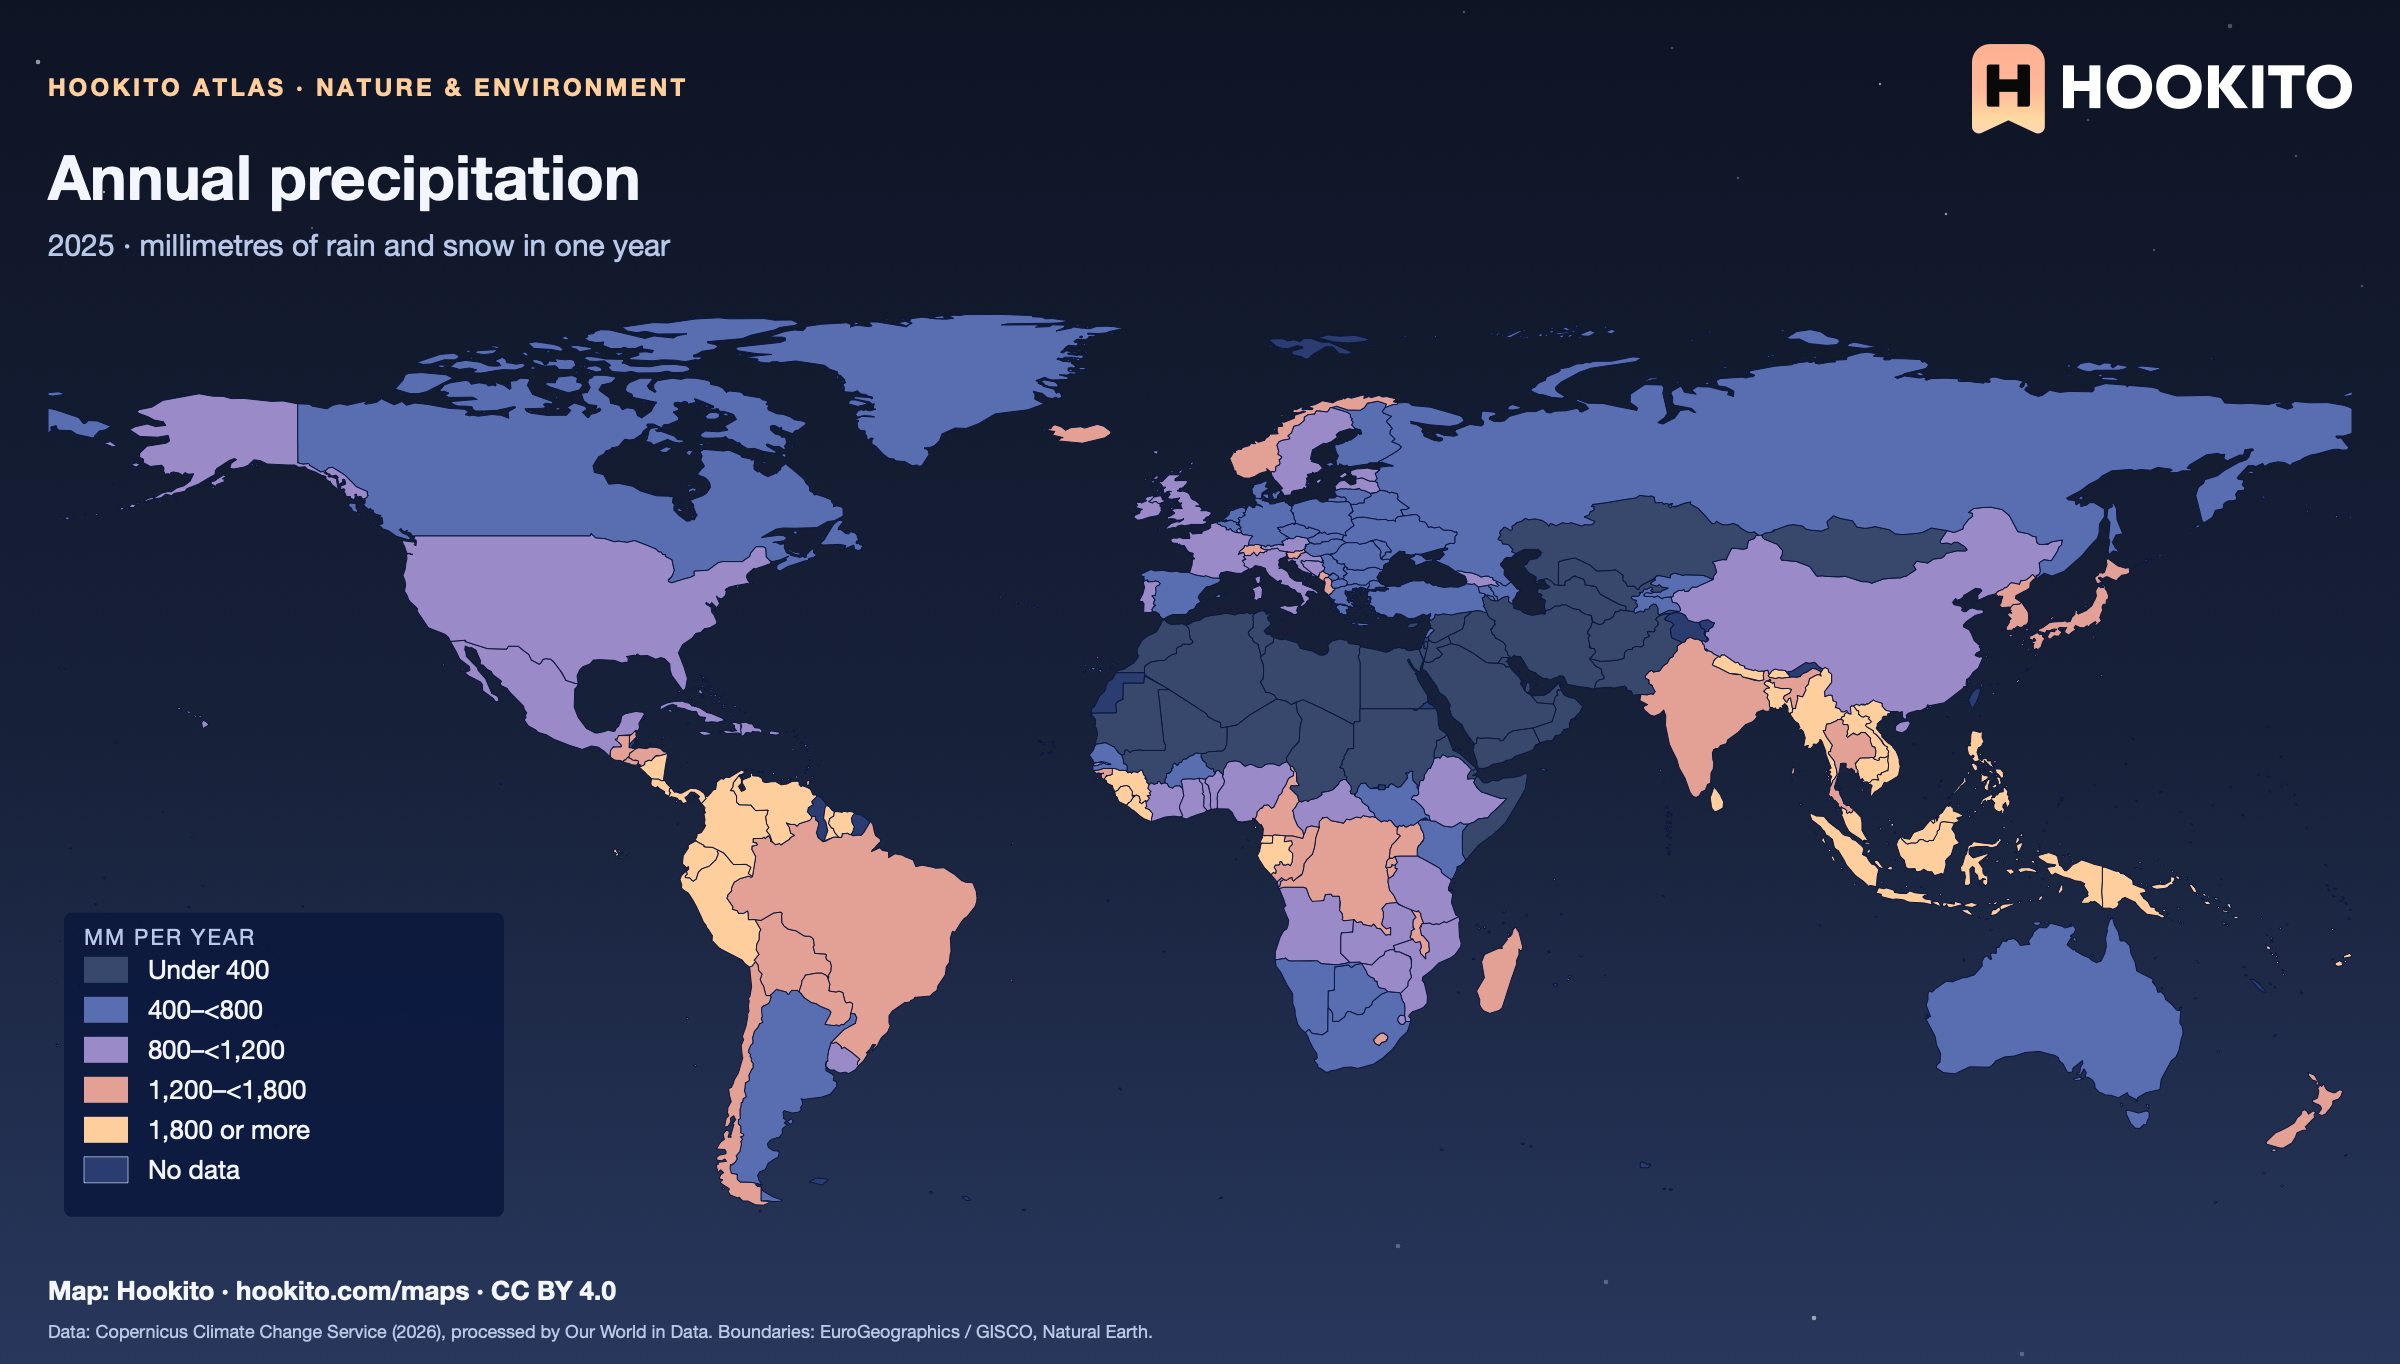
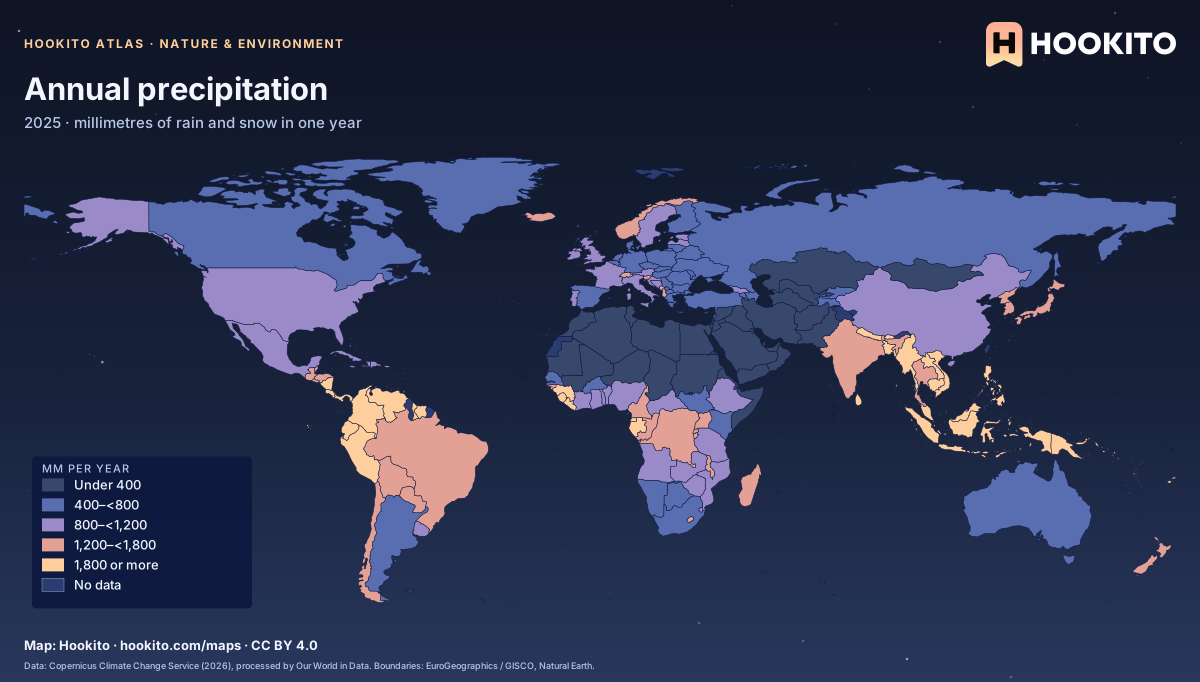
Annual precipitation

Annual precipitation, world map with five colour bands and missing data.

Total rain and snow, excluding fog and dew, from reanalysis data for the single year 2025. This is not a long-term climate average, so a wet or dry year can differ from the usual. Grey-blue indicates no data. Source details and reuse terms: https://ourworldindata.org/grapher/average-precipitation-per-year.

Embed this map

Data: Contains modified Copernicus Climate Change Service information (2026), via Our World in Data (https://ourworldindata.org/grapher/average-precipitation-per-year). Administrative boundaries © EuroGeographics (Eurostat GISCO). Additional boundaries: Natural Earth (public domain). Source data and citation ↗
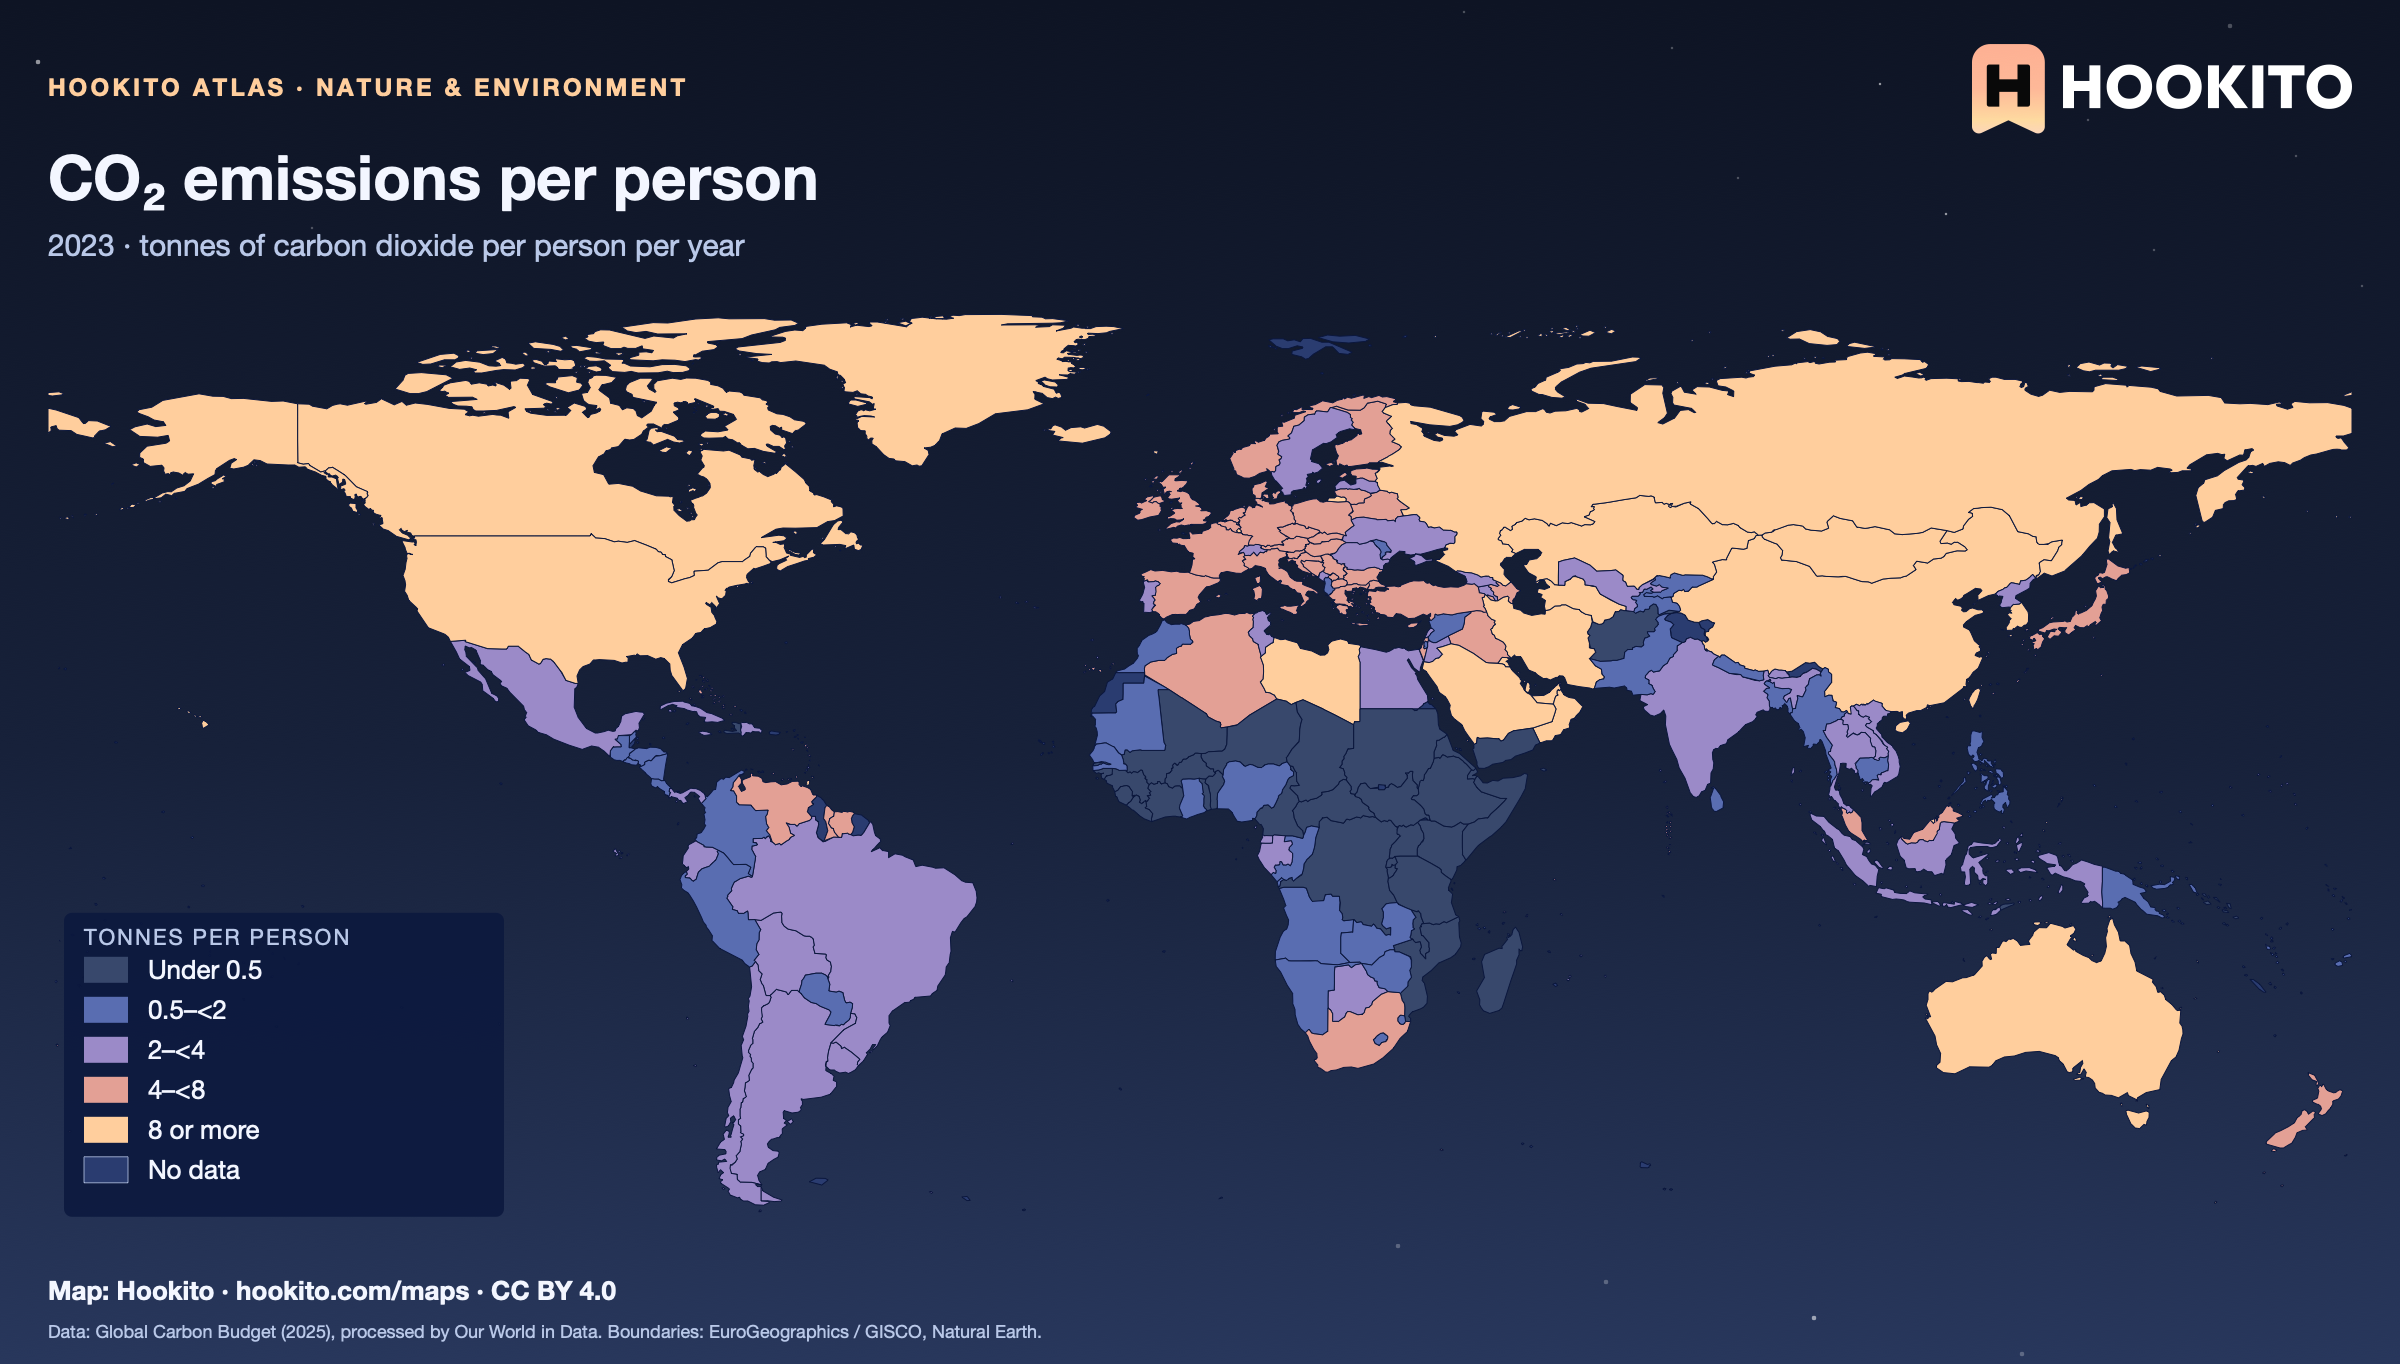
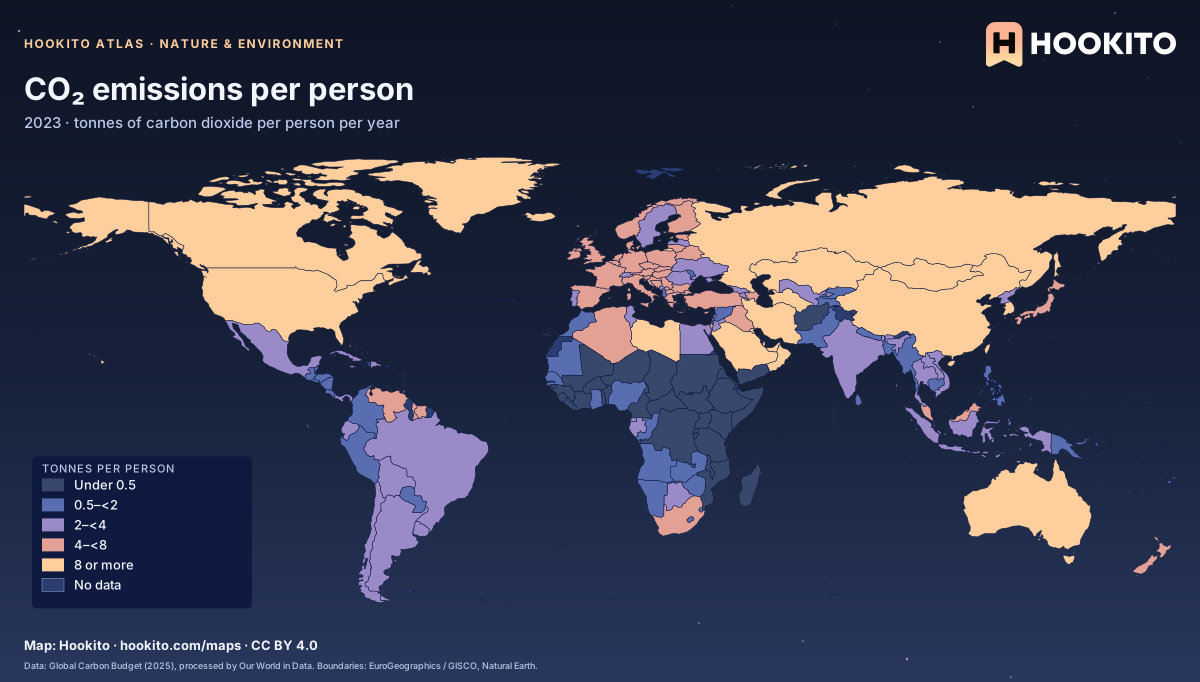
CO₂ emissions per person

CO₂ emissions per person, world map with five colour bands and missing data.

Carbon dioxide emitted within each country in 2023, divided by its population. Emissions embedded in traded goods are counted where the goods are made, not where they are used. Grey-blue indicates no data. Source details and reuse terms: https://ourworldindata.org/grapher/co2-emissions-per-capita.

Embed this map

Data: Global Carbon Budget (2025); Population based on various sources (2024), via Our World in Data (https://ourworldindata.org/grapher/co2-emissions-per-capita). Administrative boundaries © EuroGeographics (Eurostat GISCO). Additional boundaries: Natural Earth (public domain). Source data and citation ↗
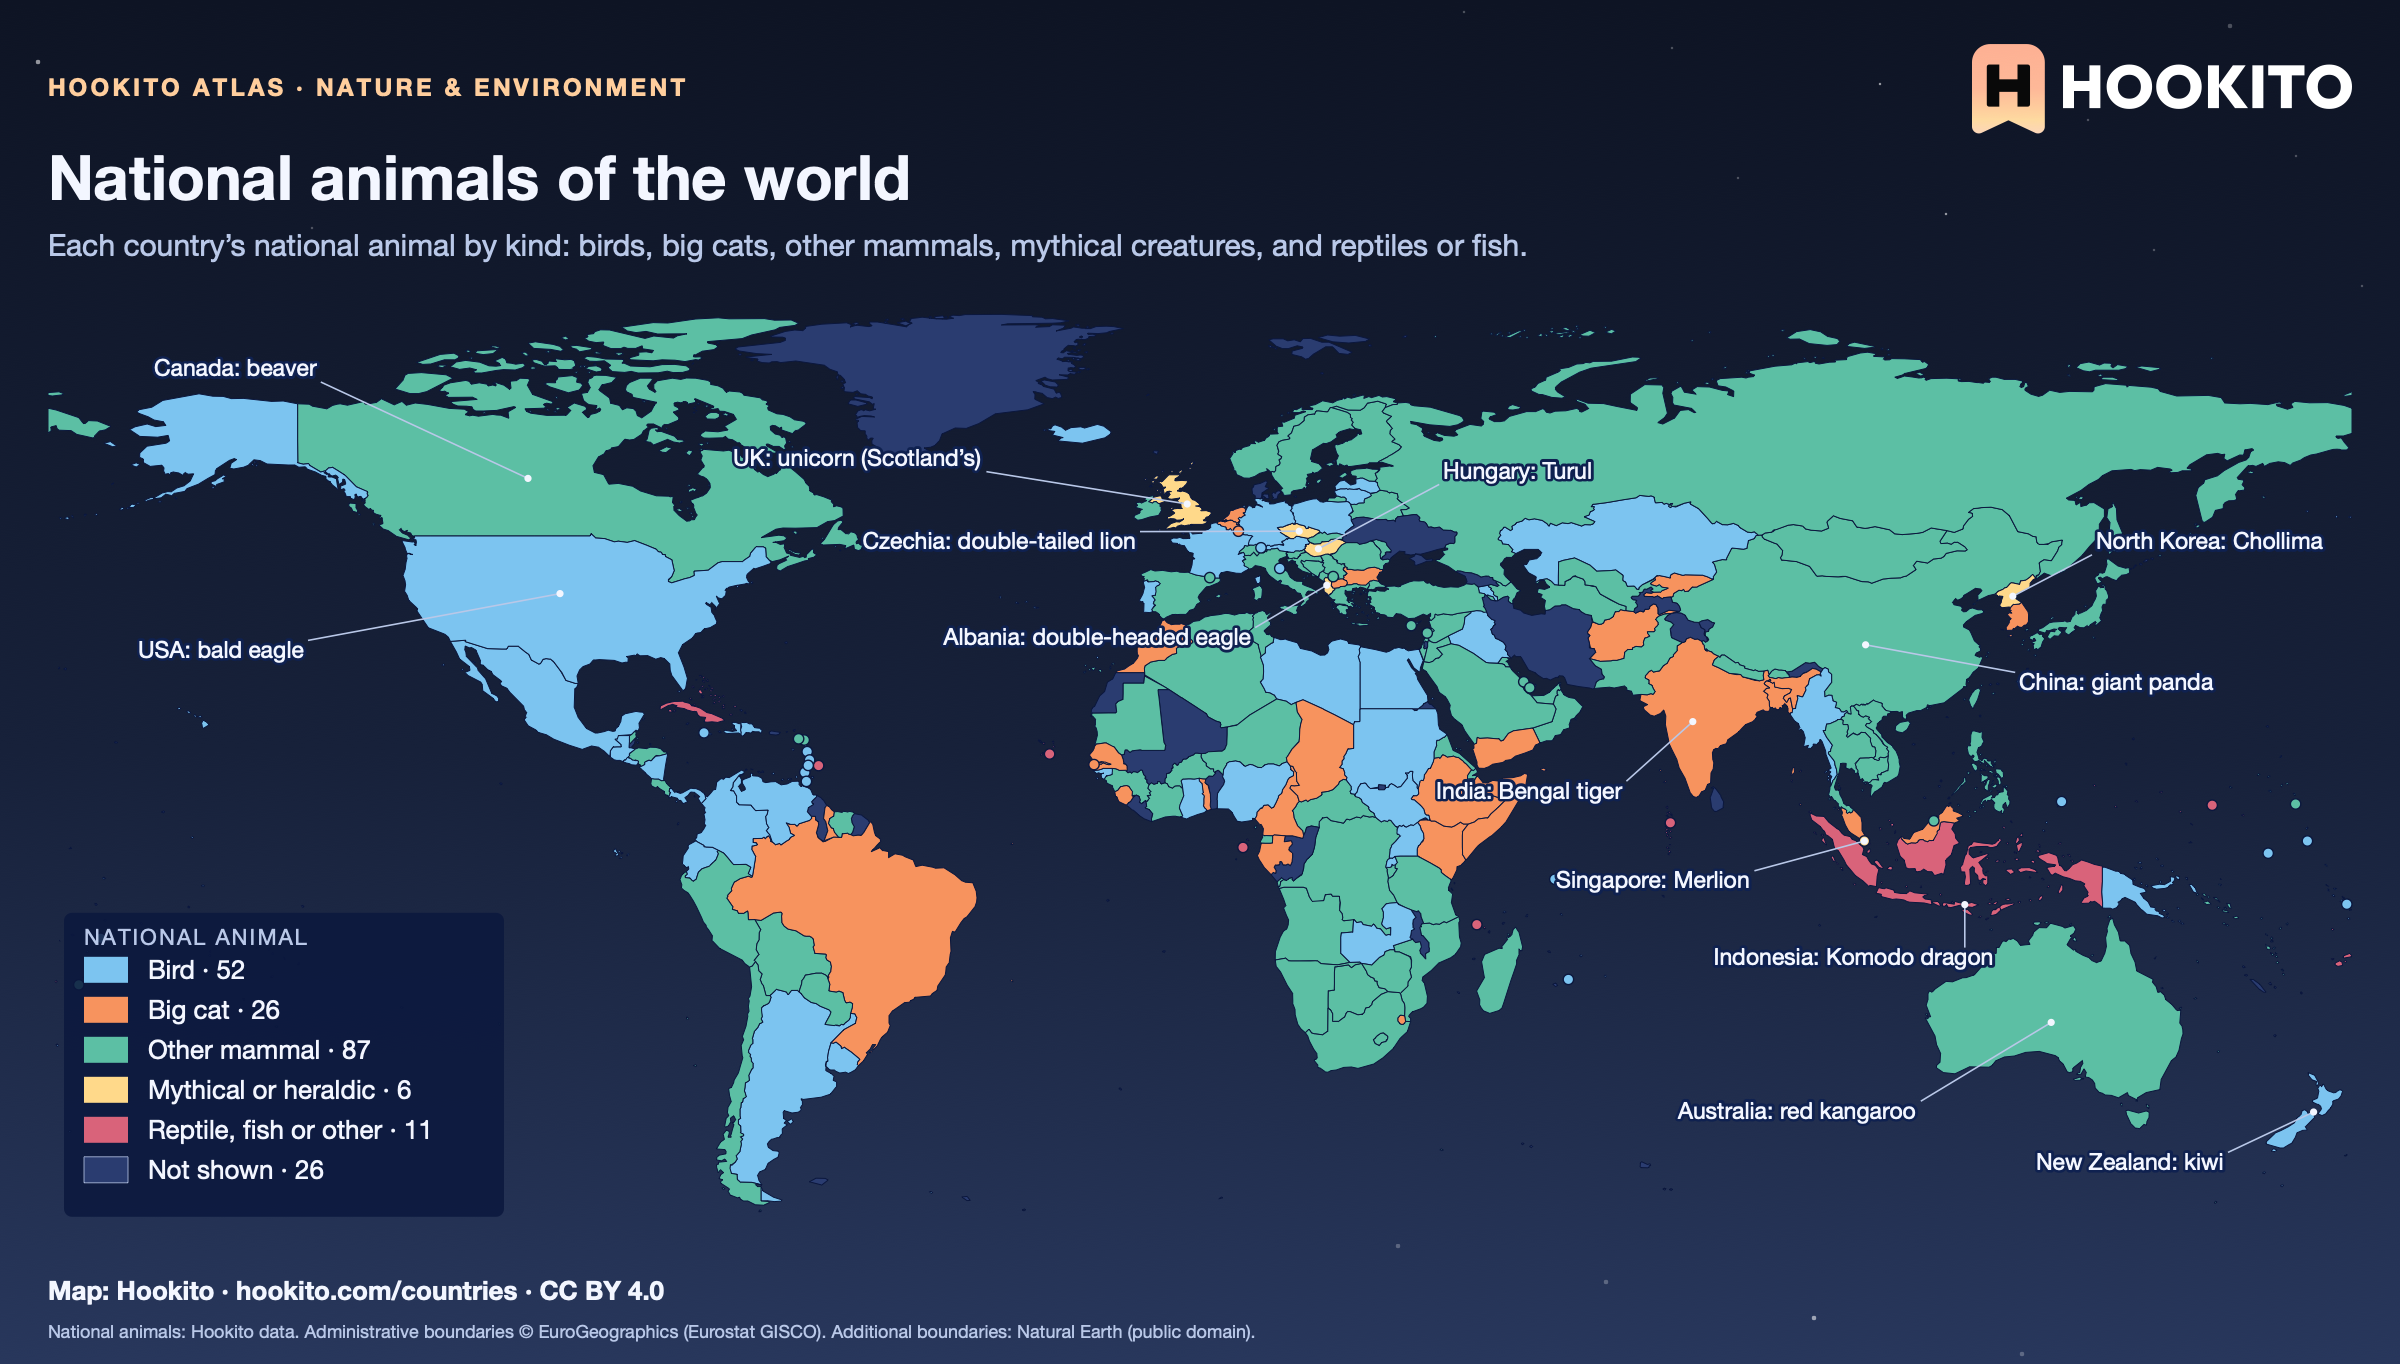
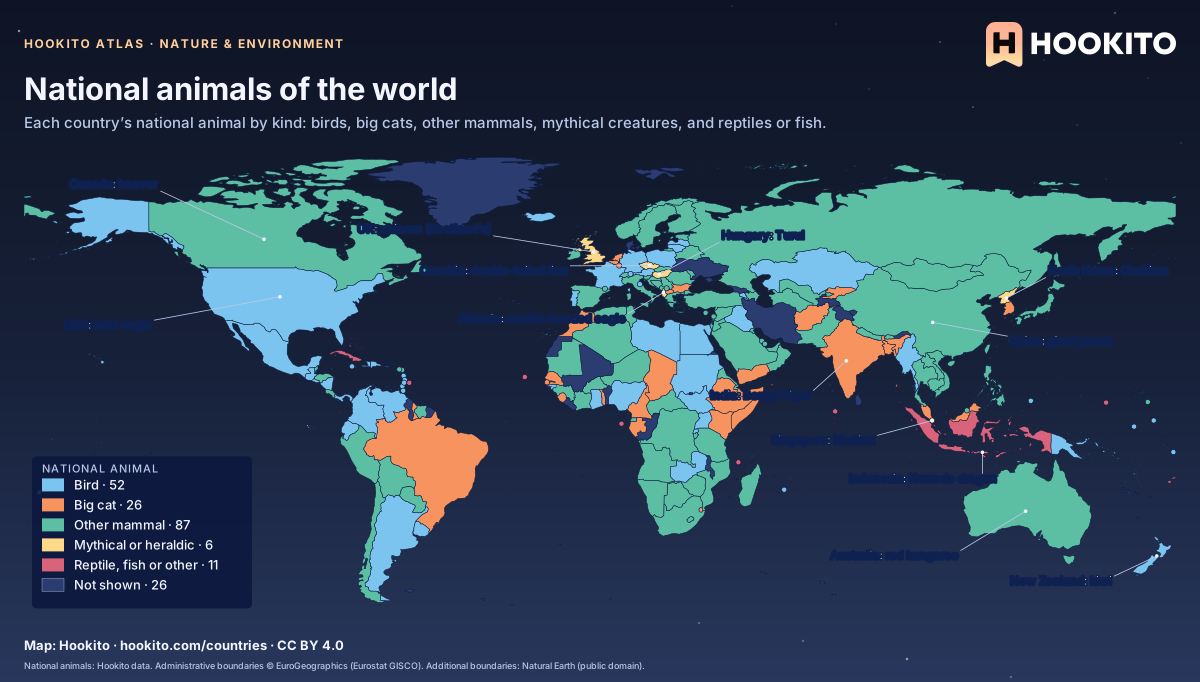
National animals of the world

World map colouring countries by the kind of their national animal: other mammals in green are the most common, birds in light blue, big cats in orange, mythical creatures in yellow (the UK’s unicorn, Albania’s double-headed eagle, Hungary’s Turul, North Korea’s Chollima, Singapore’s Merlion), with labelled examples.

87 countries have a mammal other than a big cat, 52 a bird and 26 a big cat, most often the lion; 6 have a mythical or heraldic creature. Many countries name more than one animal or none officially, so this map shows one per country as listed in Hookito’s data. 11 countries whose entry is doubtful, and those without one, are not shown.

Embed this map

National animals: Hookito data. Administrative boundaries © EuroGeographics (Eurostat GISCO). Additional boundaries: Natural Earth (public domain).

4 maps

Energy

How countries generate electricity, and who has access to it.

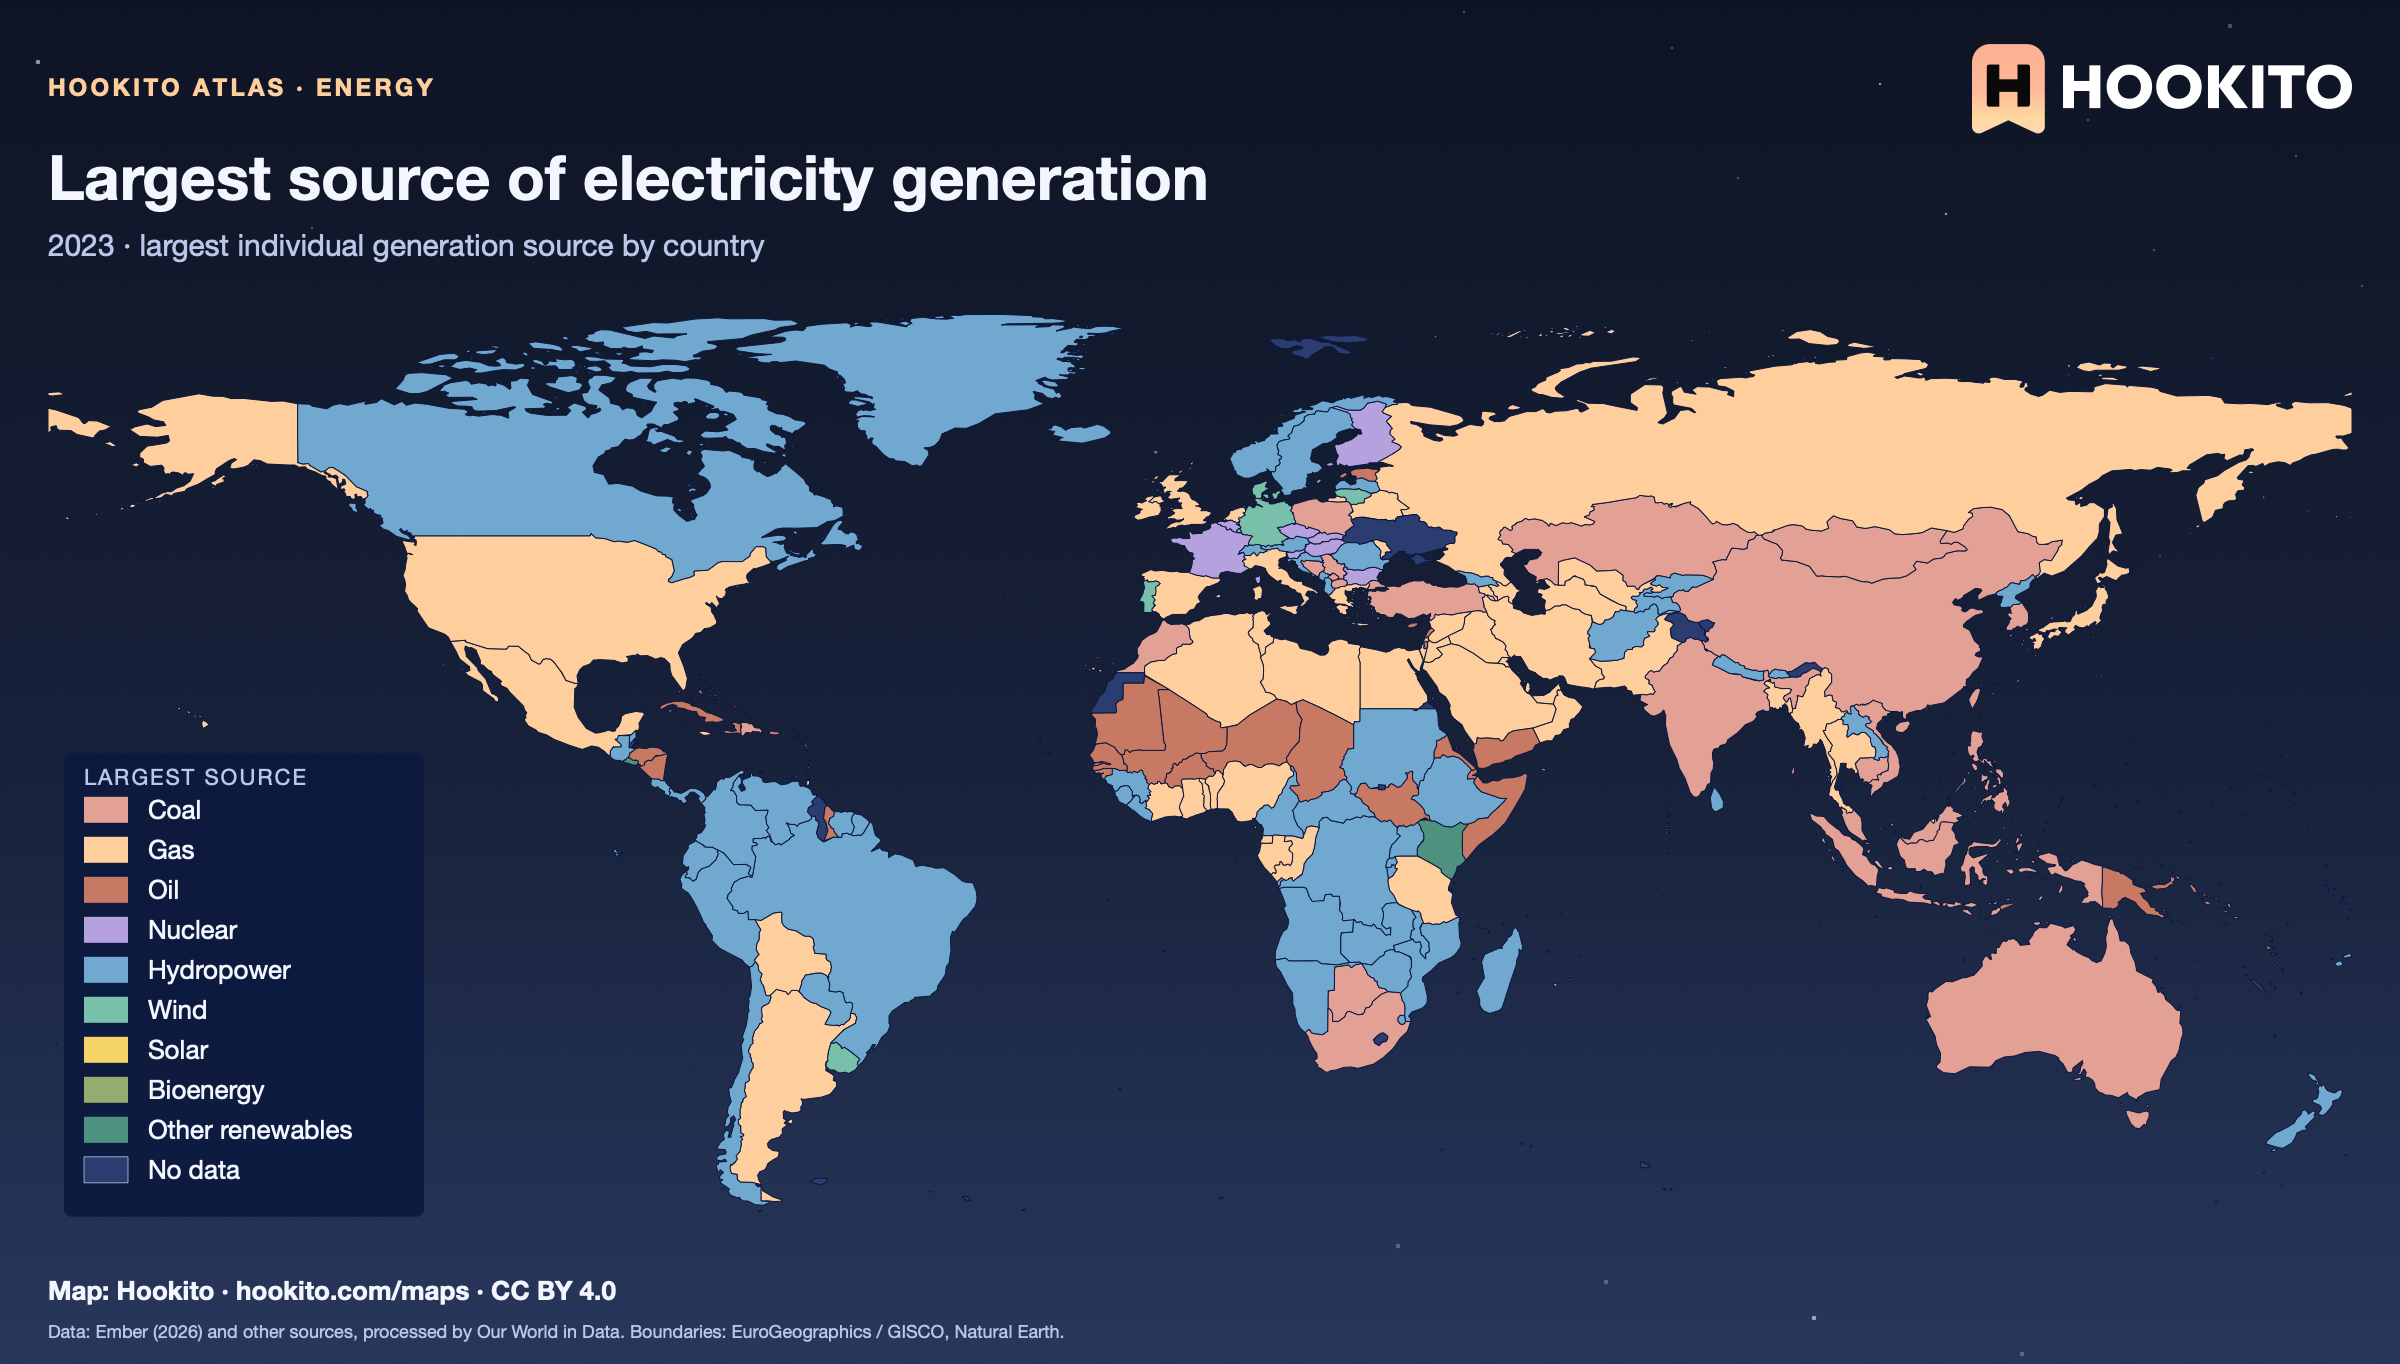
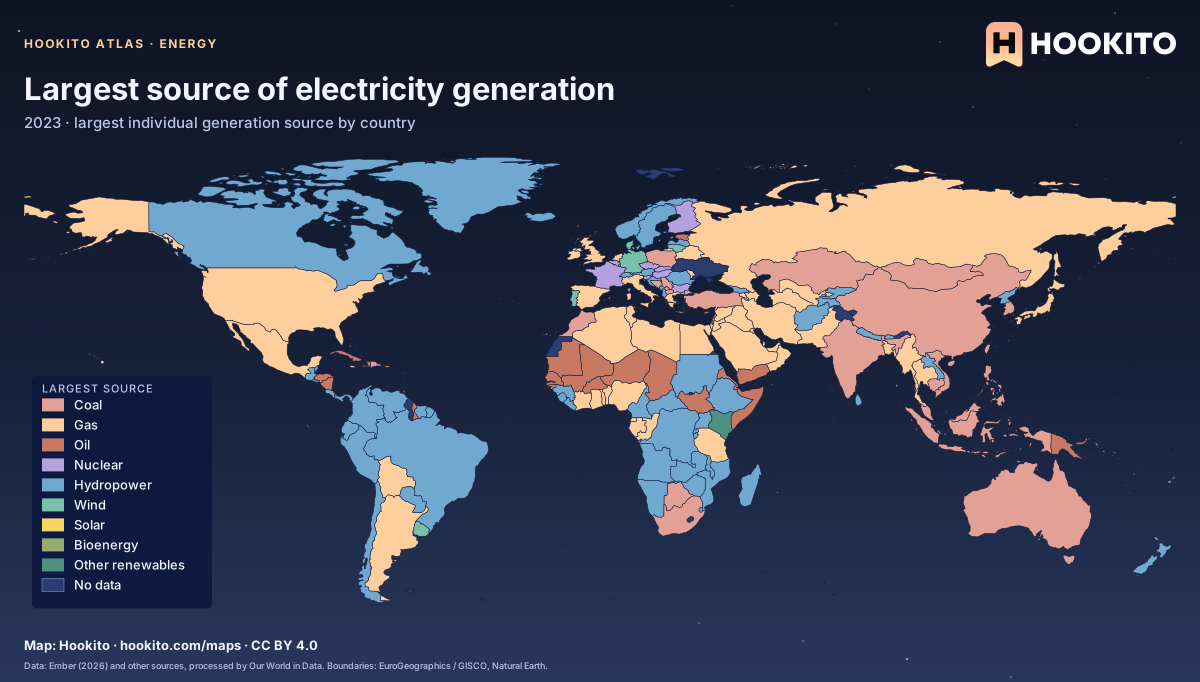
Largest source of electricity generation

World map showing each country’s largest source of electricity generation in 2023.

Largest source of electricity generation, not total energy use; it need not be a majority. Other renewables groups several sources. Grey-blue indicates no data. Source details and reuse terms: https://ourworldindata.org/grapher/electricity-prod-source-stacked.

Embed this map

Data: Ember (2026) and other sources, via Our World in Data (https://ourworldindata.org/grapher/electricity-prod-source-stacked). Administrative boundaries © EuroGeographics (Eurostat GISCO). Additional boundaries: Natural Earth (public domain). Source data and citation ↗
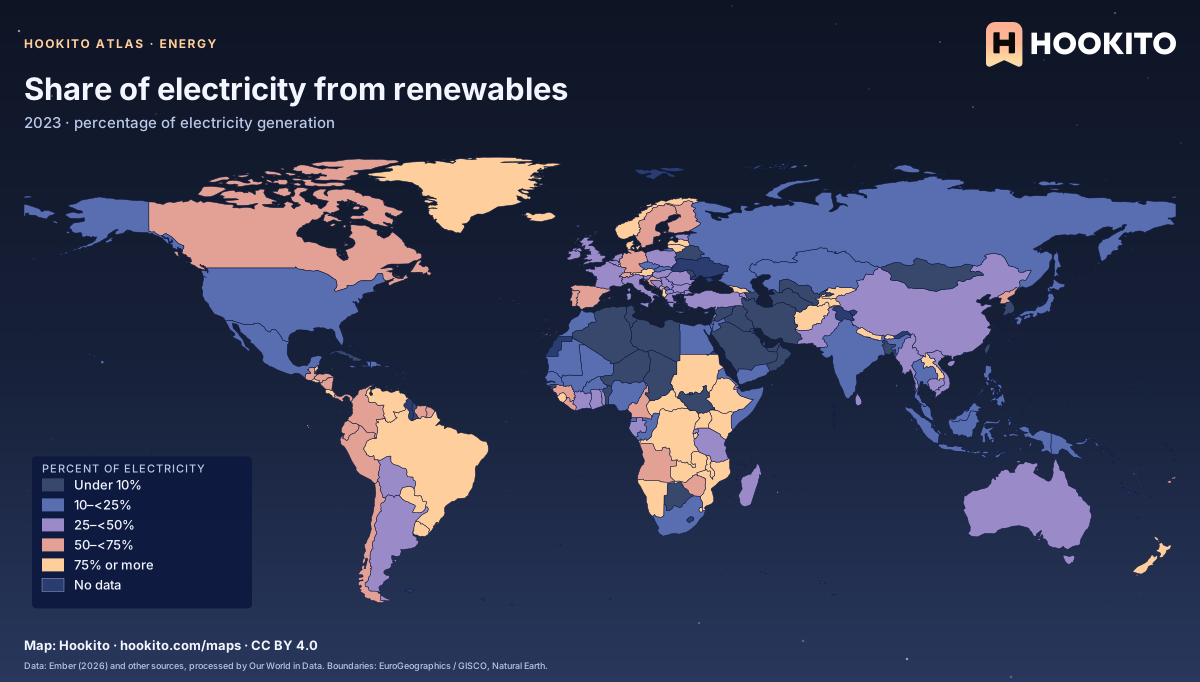
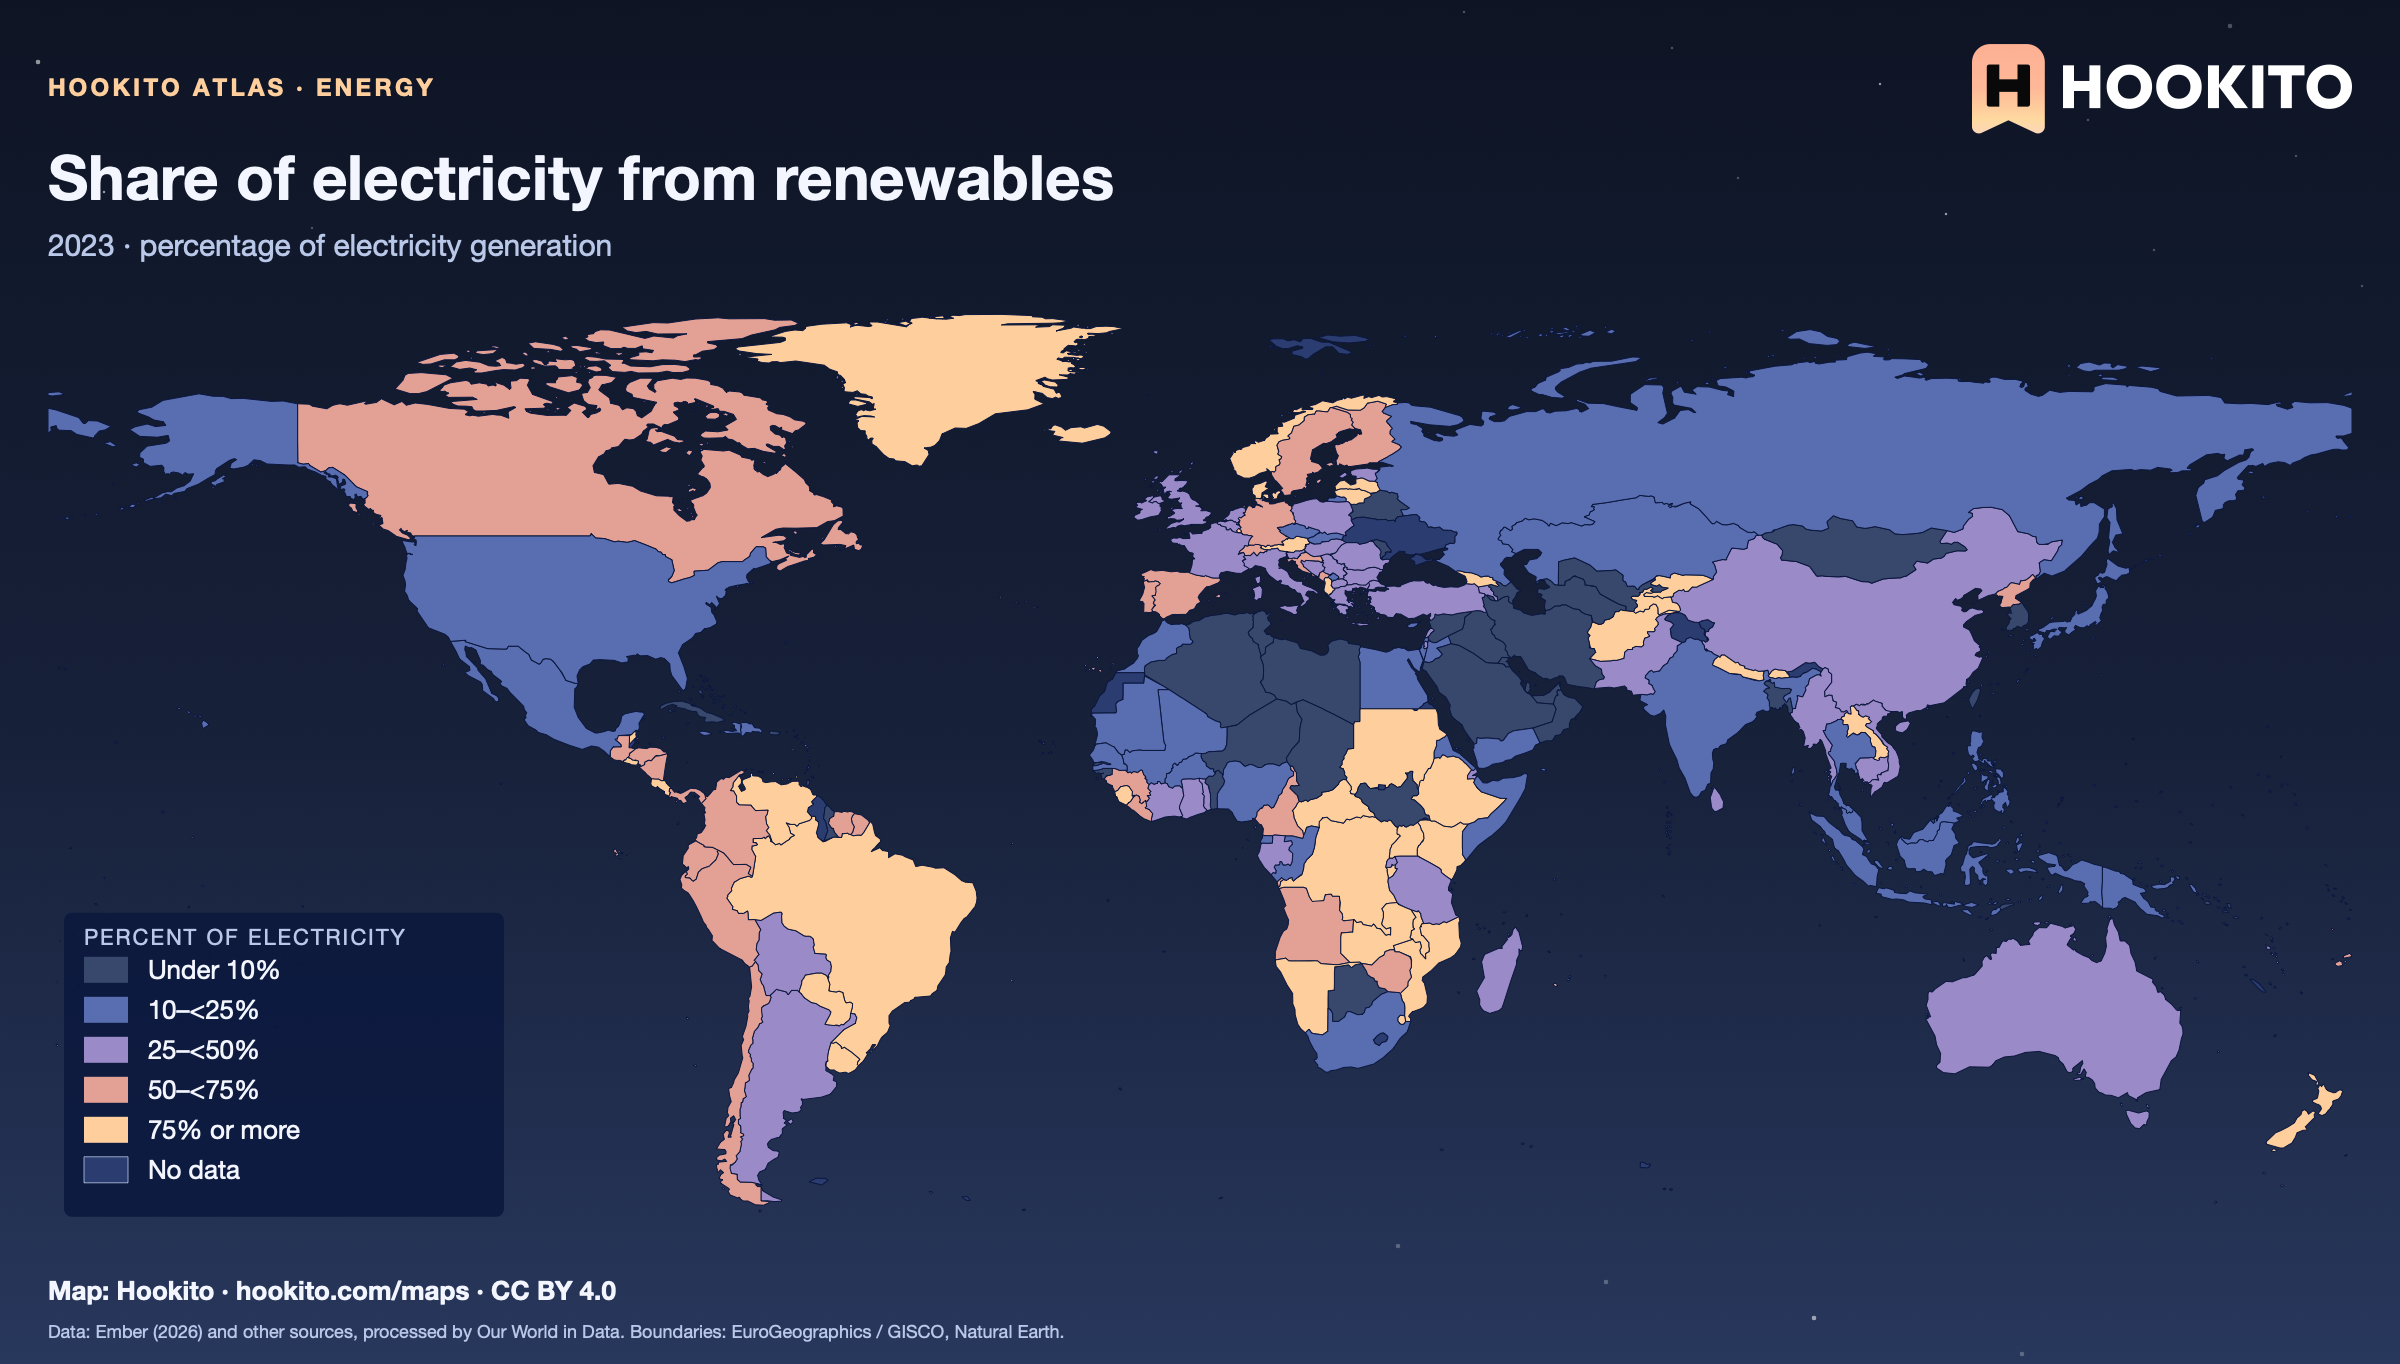
Share of electricity from renewables

Share of electricity from renewables, world map with five colour bands and missing data.

Hydropower, wind, solar, bioenergy and other renewables as a percentage of total electricity generation, not of all energy use. Figures are for 2023. Grey-blue indicates no data. Source details and reuse terms: https://ourworldindata.org/grapher/share-electricity-renewables.

Embed this map

Data: Ember (2026) and other sources, via Our World in Data (https://ourworldindata.org/grapher/share-electricity-renewables). Administrative boundaries © EuroGeographics (Eurostat GISCO). Additional boundaries: Natural Earth (public domain). Source data and citation ↗
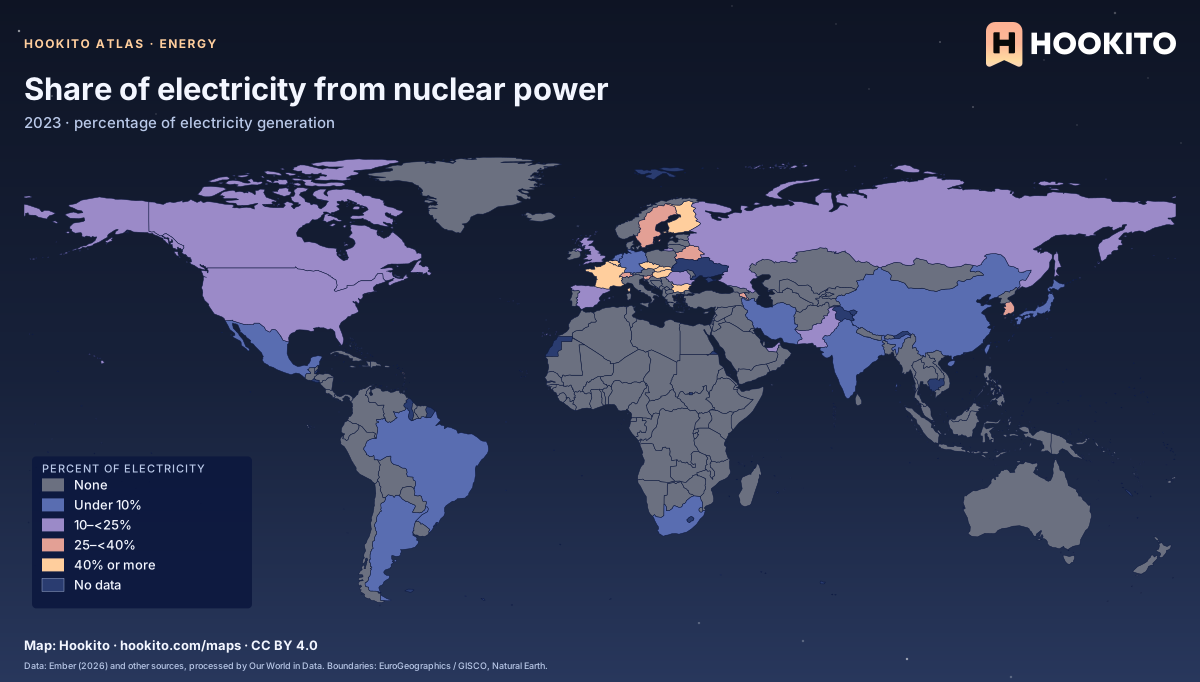
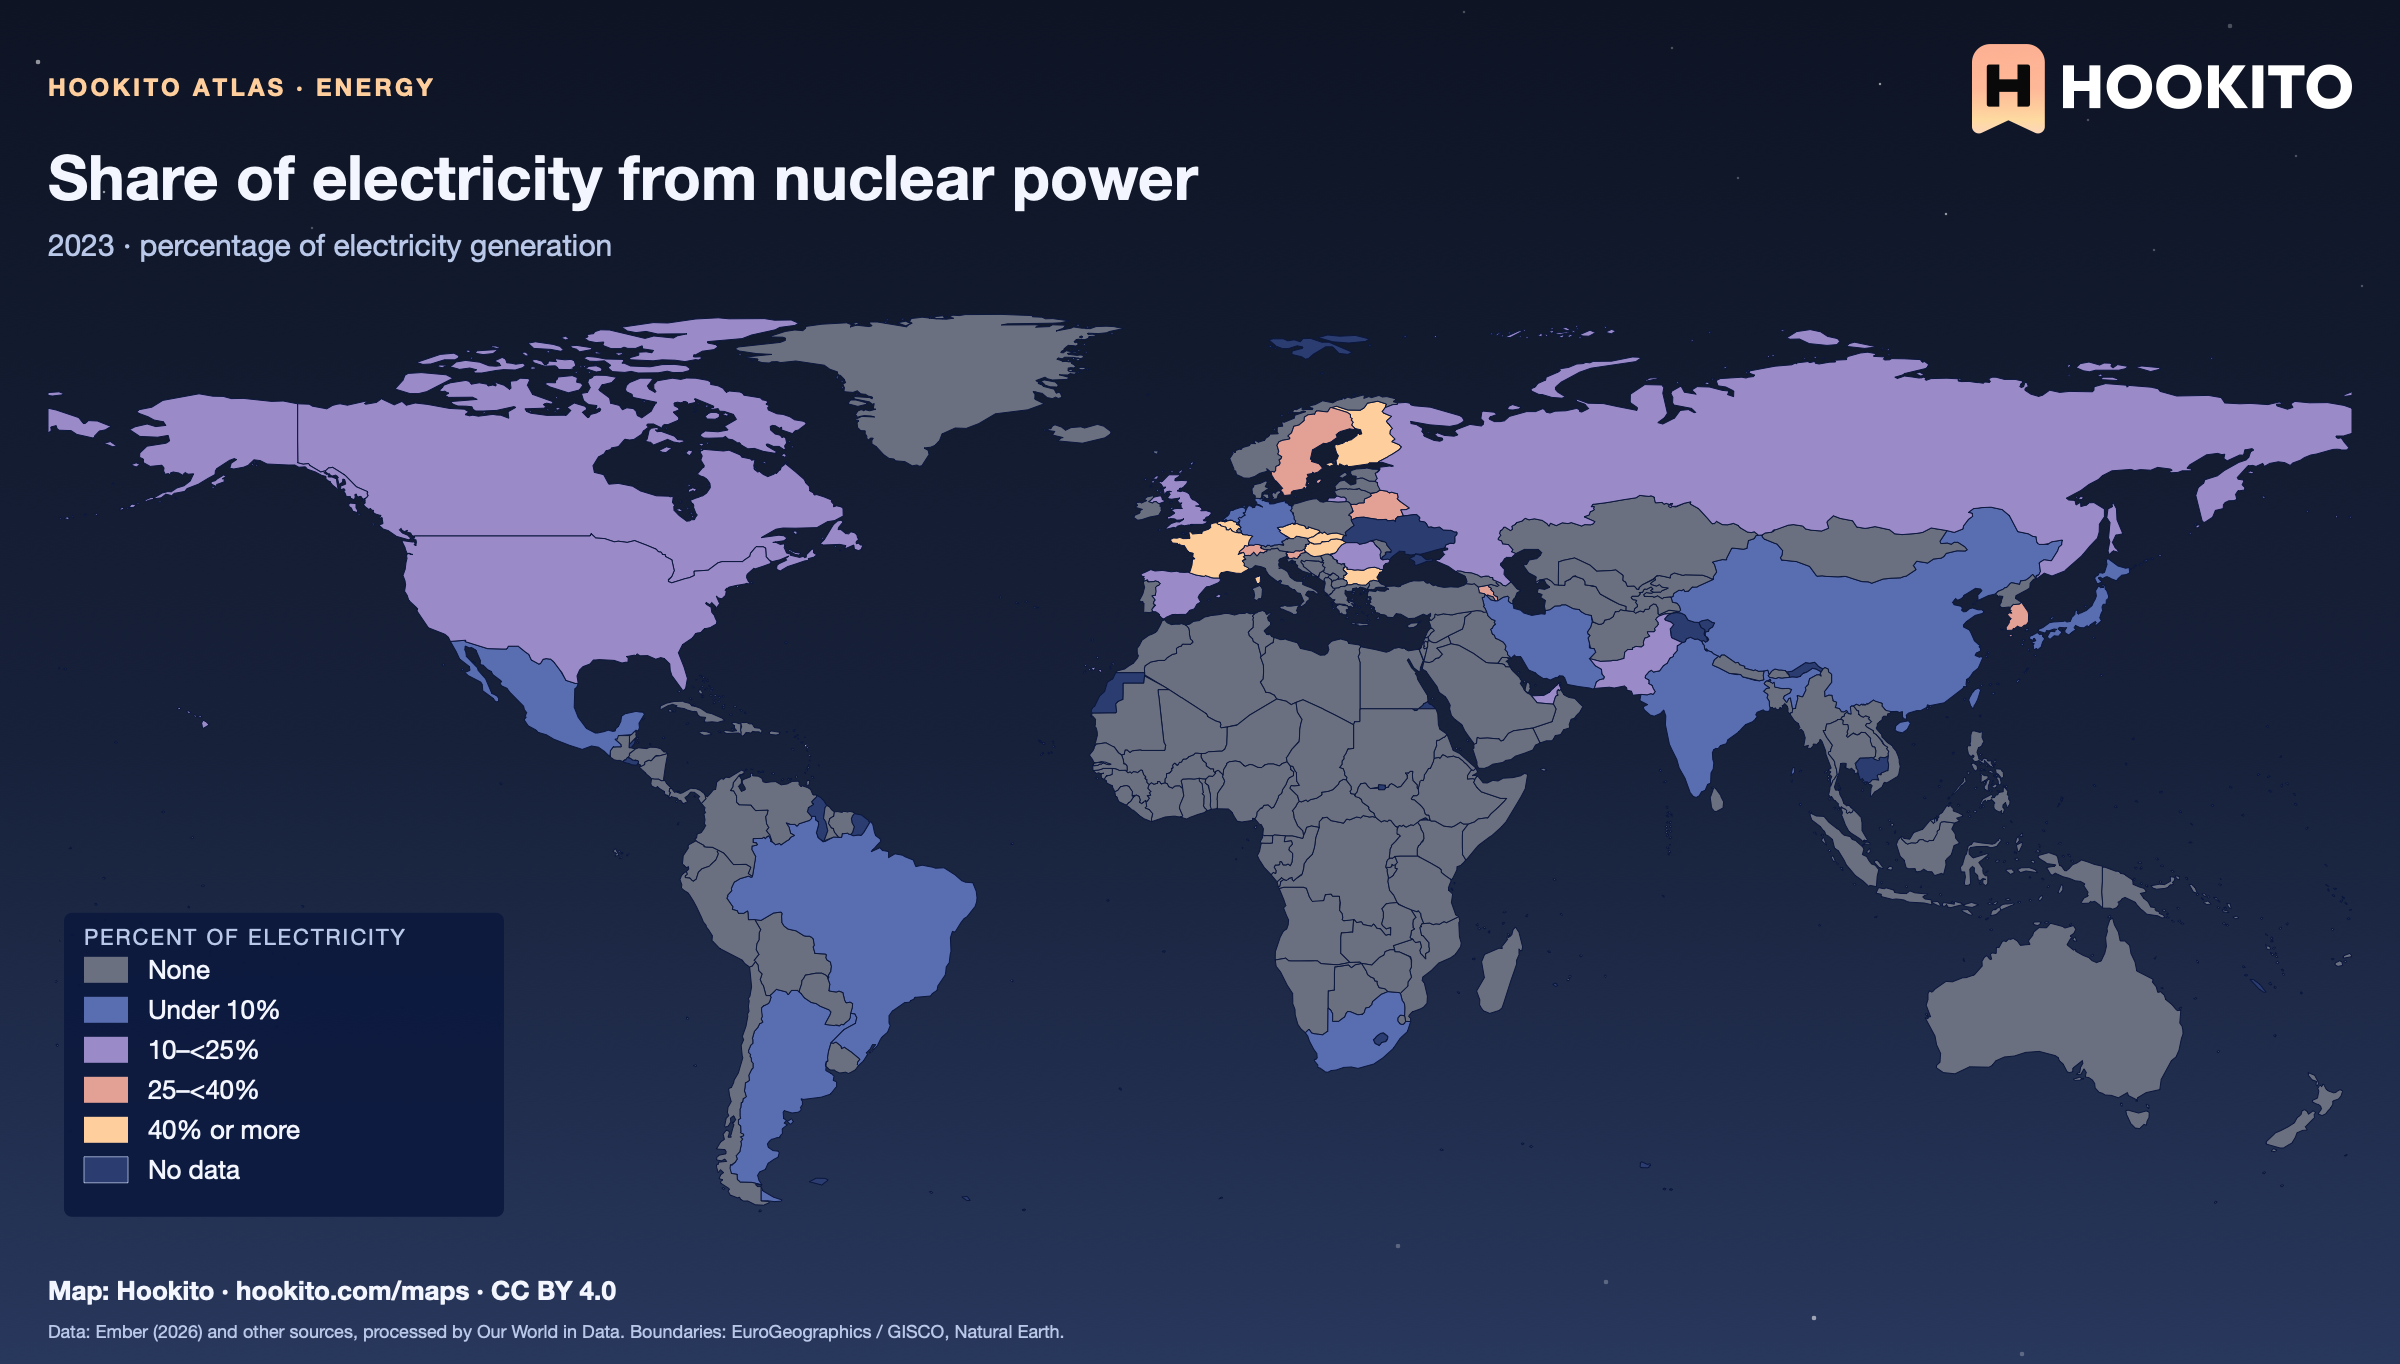
Share of electricity from nuclear power

Share of electricity from nuclear power, world map with five colour bands and missing data.

Nuclear power as a percentage of total electricity generation in 2023. Most countries have no nuclear power and fall in the first class, so the map mainly shows where it matters. Grey-blue indicates no data. Source details and reuse terms: https://ourworldindata.org/grapher/share-electricity-nuclear.

Embed this map

Data: Ember (2026) and other sources, via Our World in Data (https://ourworldindata.org/grapher/share-electricity-nuclear). Administrative boundaries © EuroGeographics (Eurostat GISCO). Additional boundaries: Natural Earth (public domain). Source data and citation ↗
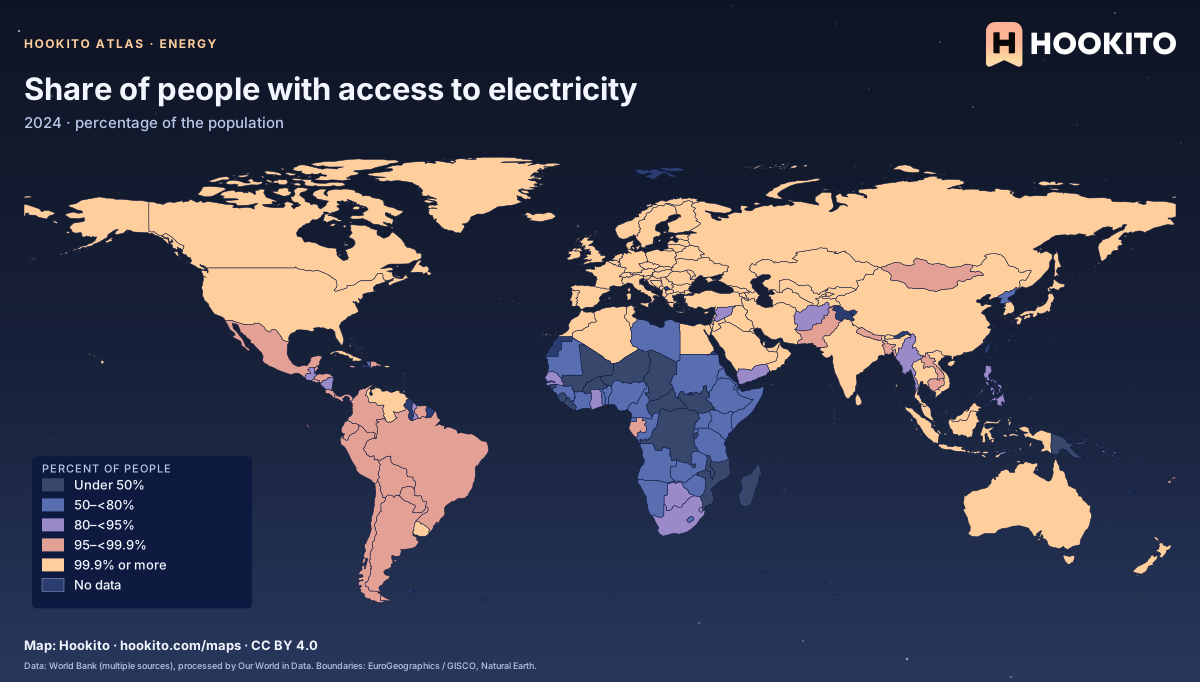
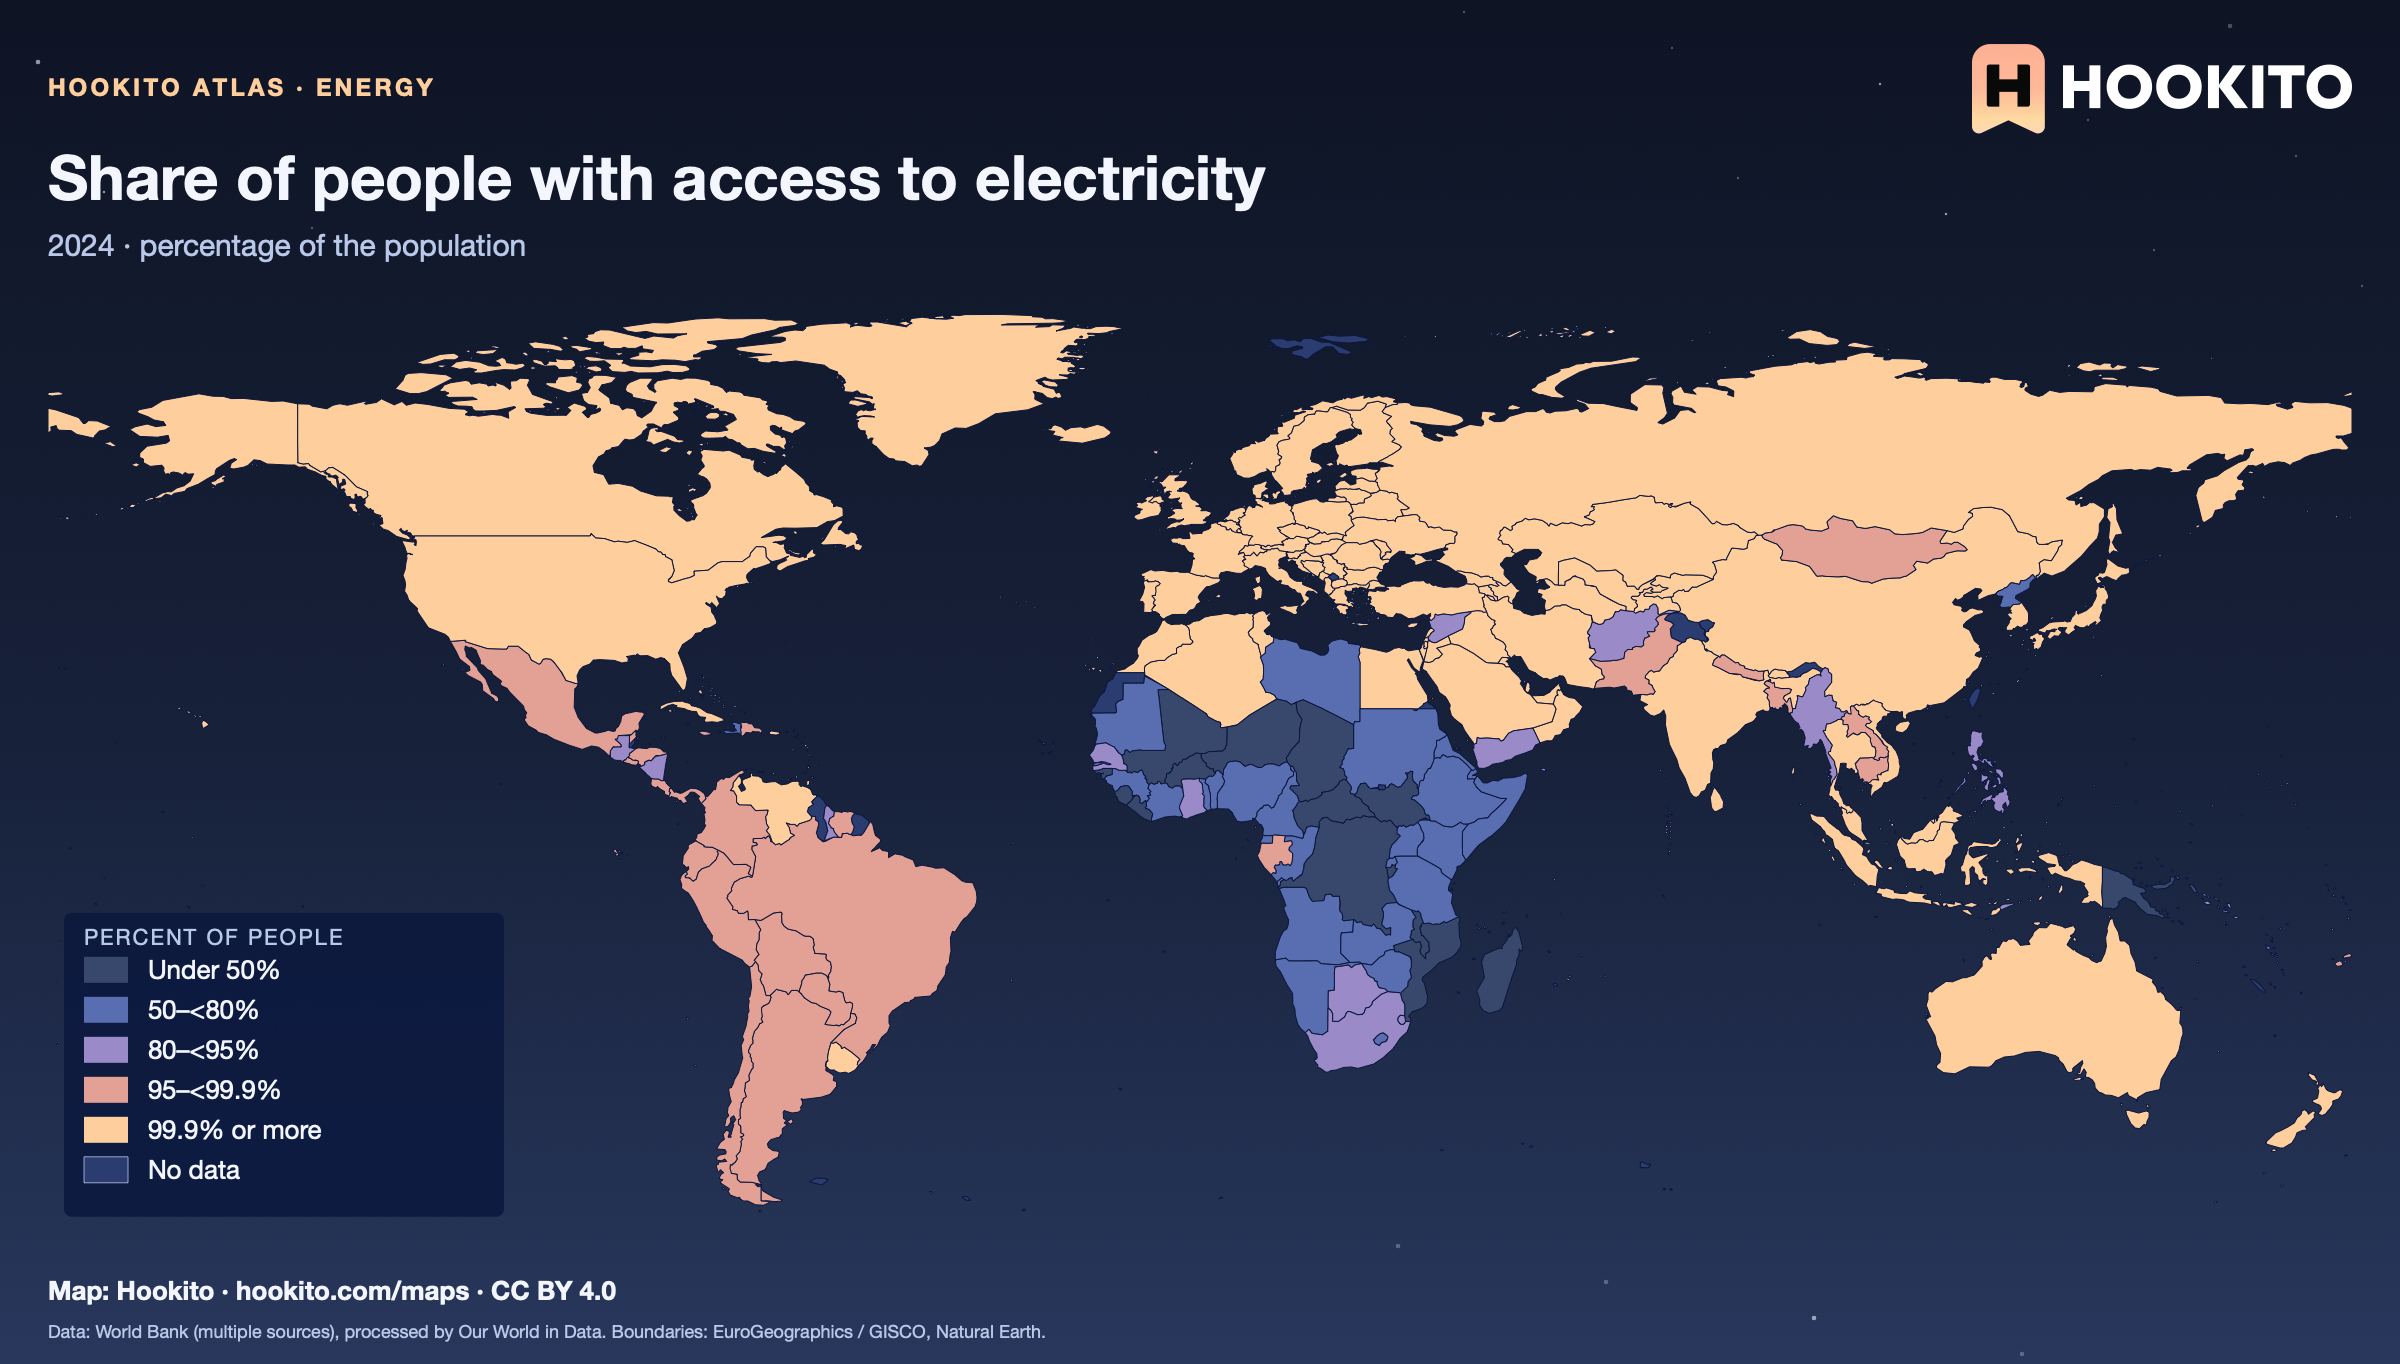
Share of people with access to electricity

Share of people with access to electricity, world map with five colour bands and missing data.

People with access to electricity at home. Most countries are at or near 100%, so the classes are skewed to separate the countries where access is still limited, mainly in sub-Saharan Africa. Figures are for 2024. Grey-blue indicates no data. Source details and reuse terms: https://ourworldindata.org/grapher/share-of-the-population-with-access-to-electricity.

Embed this map

Data: Data compiled from multiple sources by the World Bank, via Our World in Data (https://ourworldindata.org/grapher/share-of-the-population-with-access-to-electricity). Administrative boundaries © EuroGeographics (Eurostat GISCO). Additional boundaries: Natural Earth (public domain). Source data and citation ↗
4 maps

Culture

Painting galleries, a book from each country, monarchies and where country names come from.

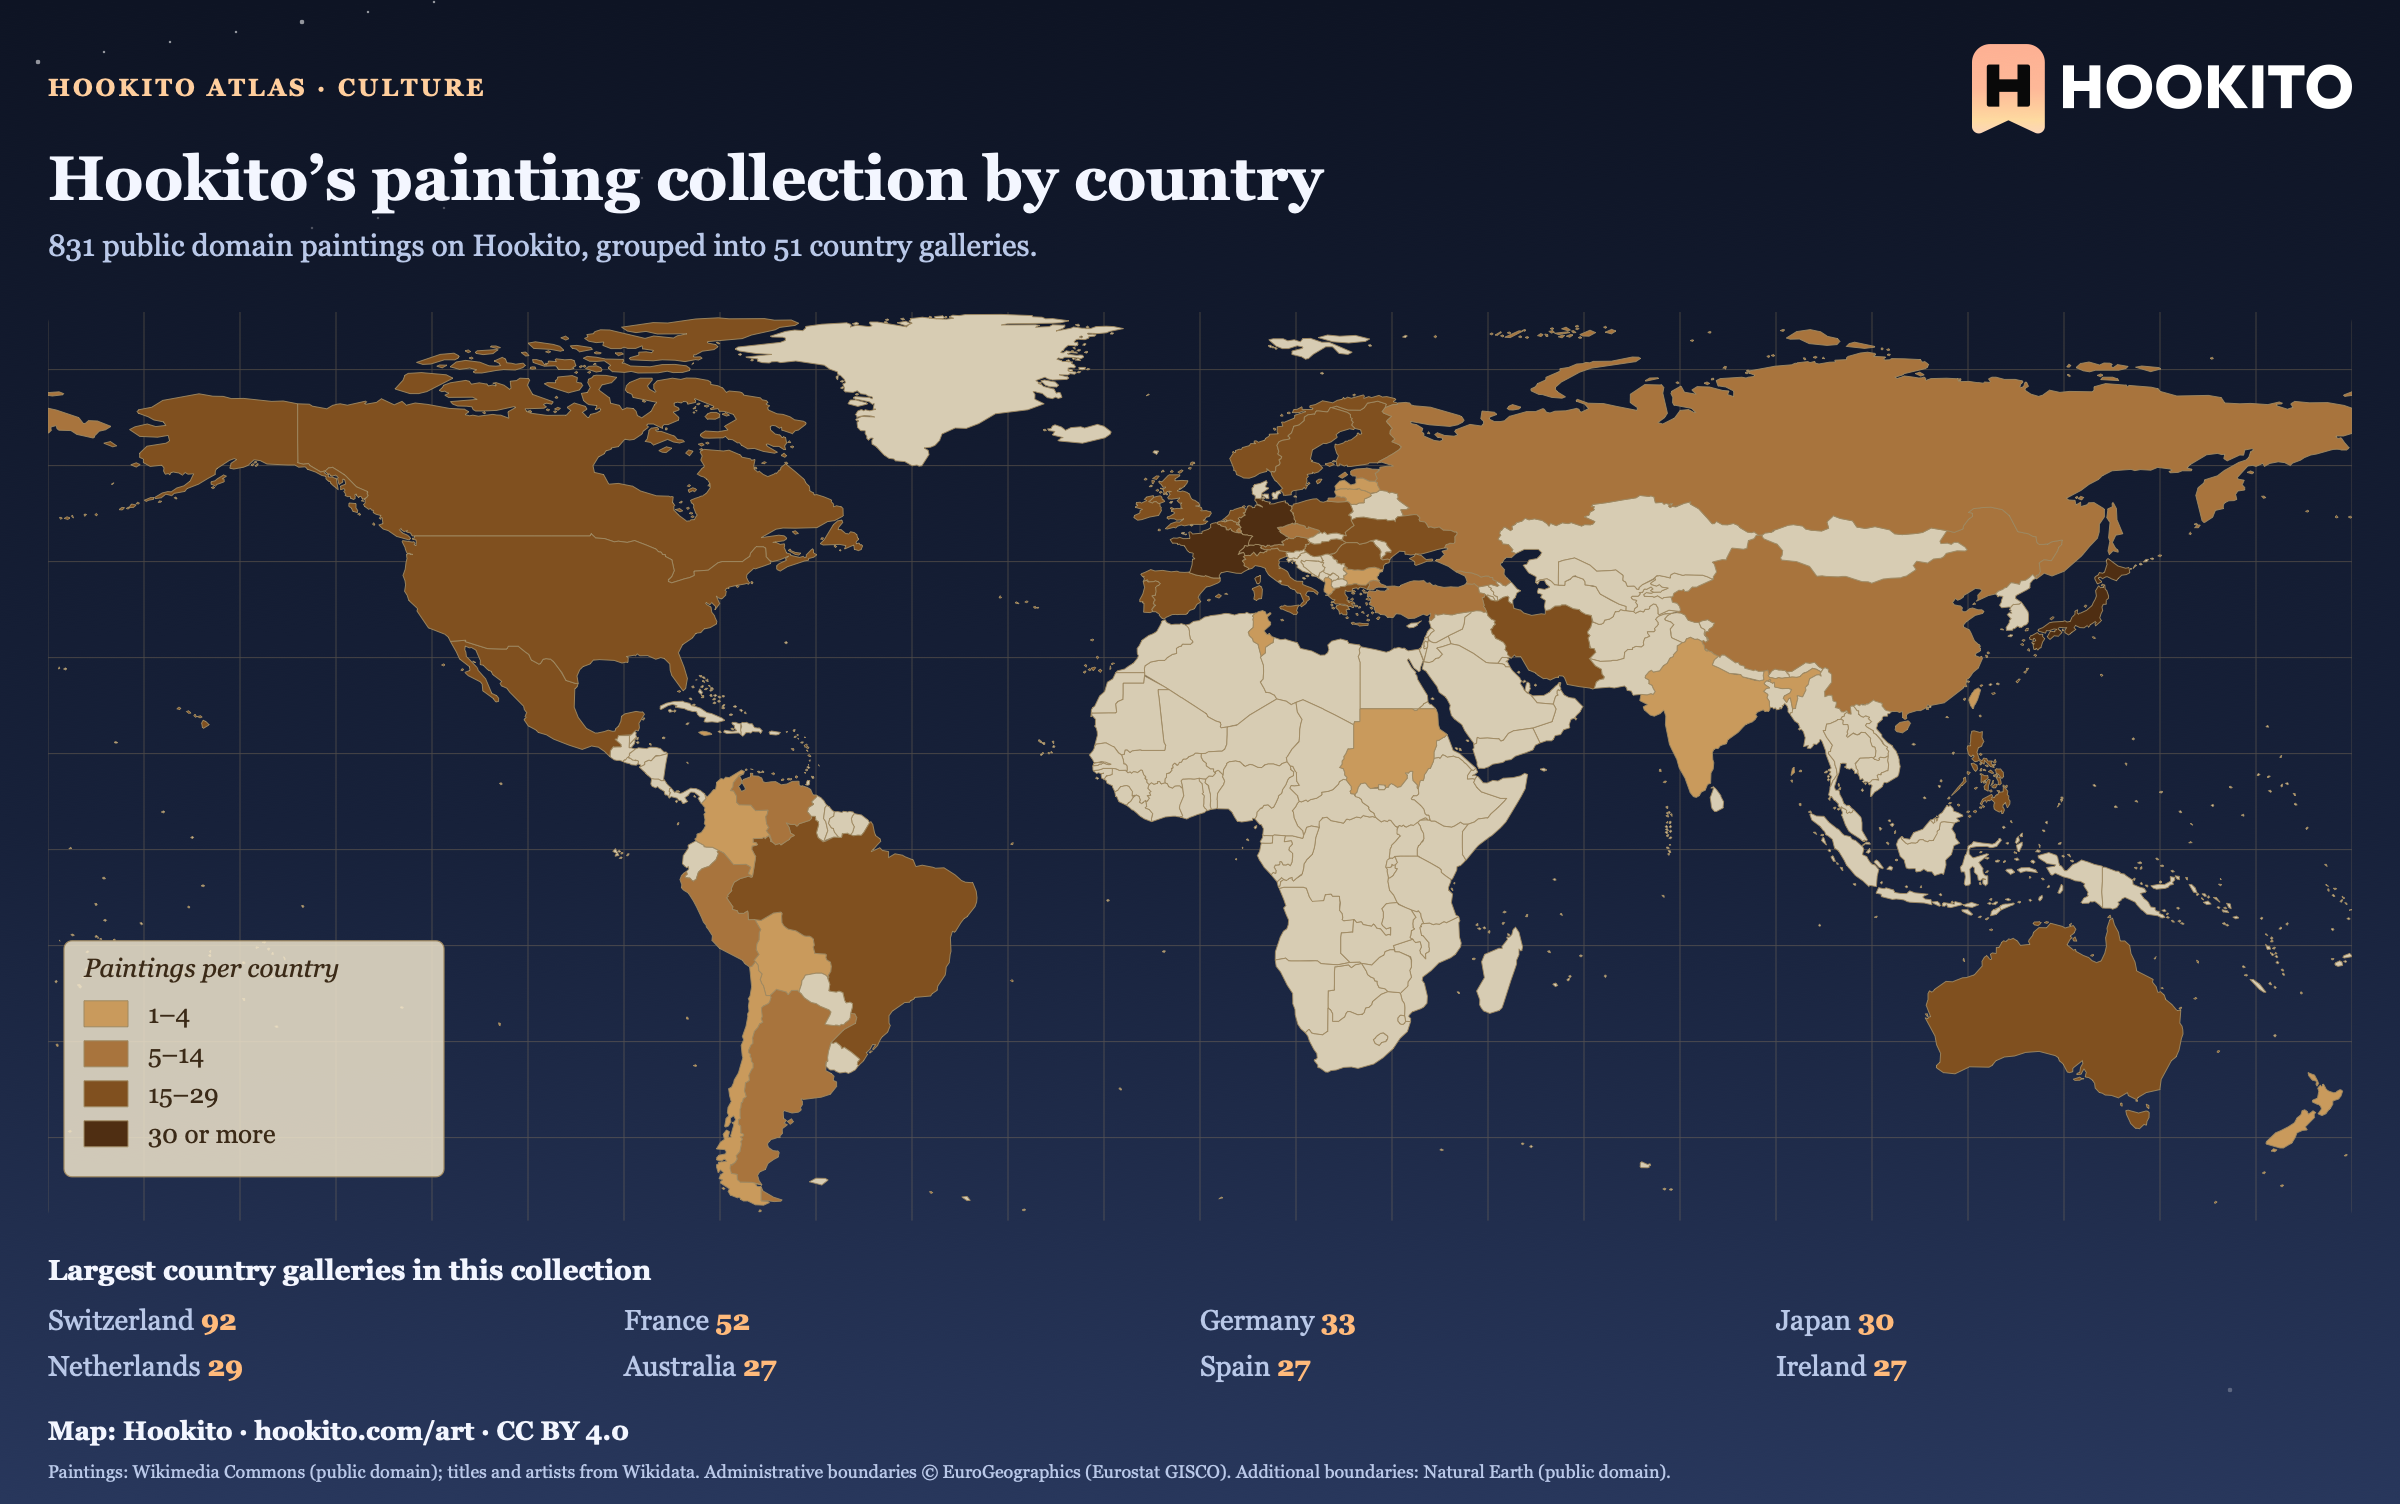
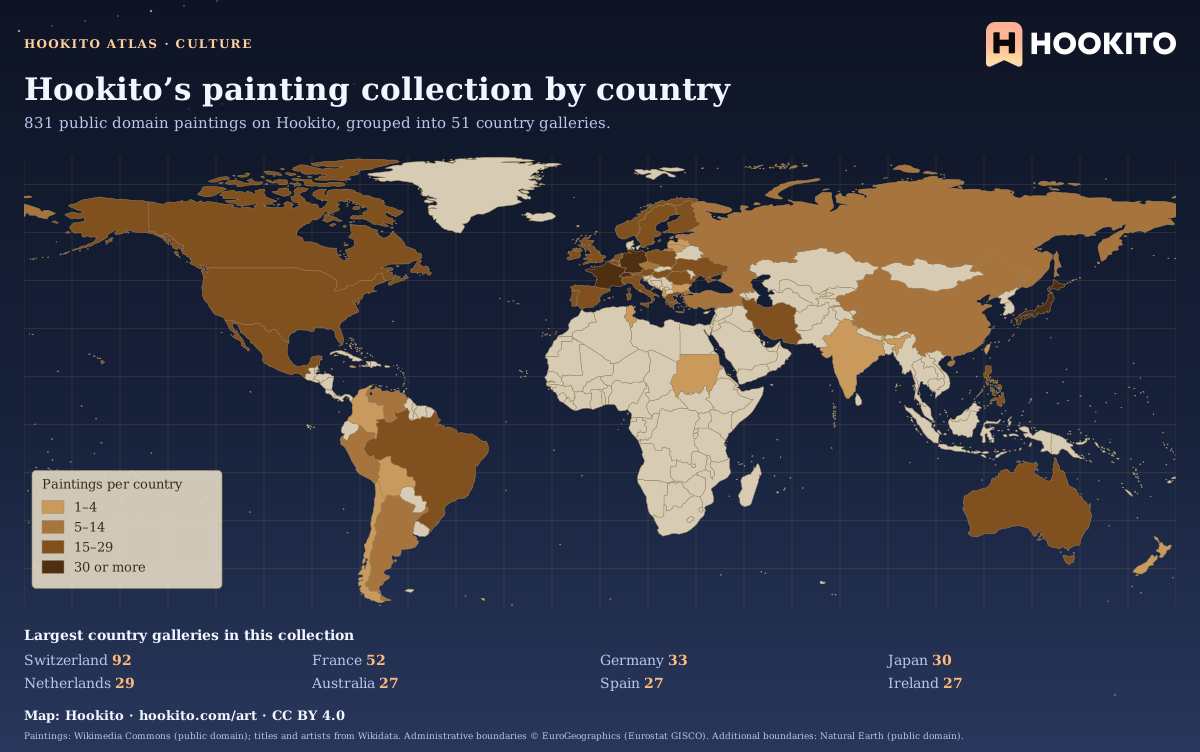
Hookito’s painting collection by country

Sepia world map shading 51 countries by how many paintings are listed in their Hookito country galleries; darker brown means more entries.

This map counts the paintings listed in Hookito’s country galleries. The country grouping comes from the artwork metadata and does not establish where a painting was created or where it is displayed today. Unshaded countries have no paintings in this collection yet.

Embed this map

Paintings: Wikimedia Commons (public domain); titles and artists from Wikidata. Administrative boundaries © EuroGeographics (Eurostat GISCO). Additional boundaries: Natural Earth (public domain).

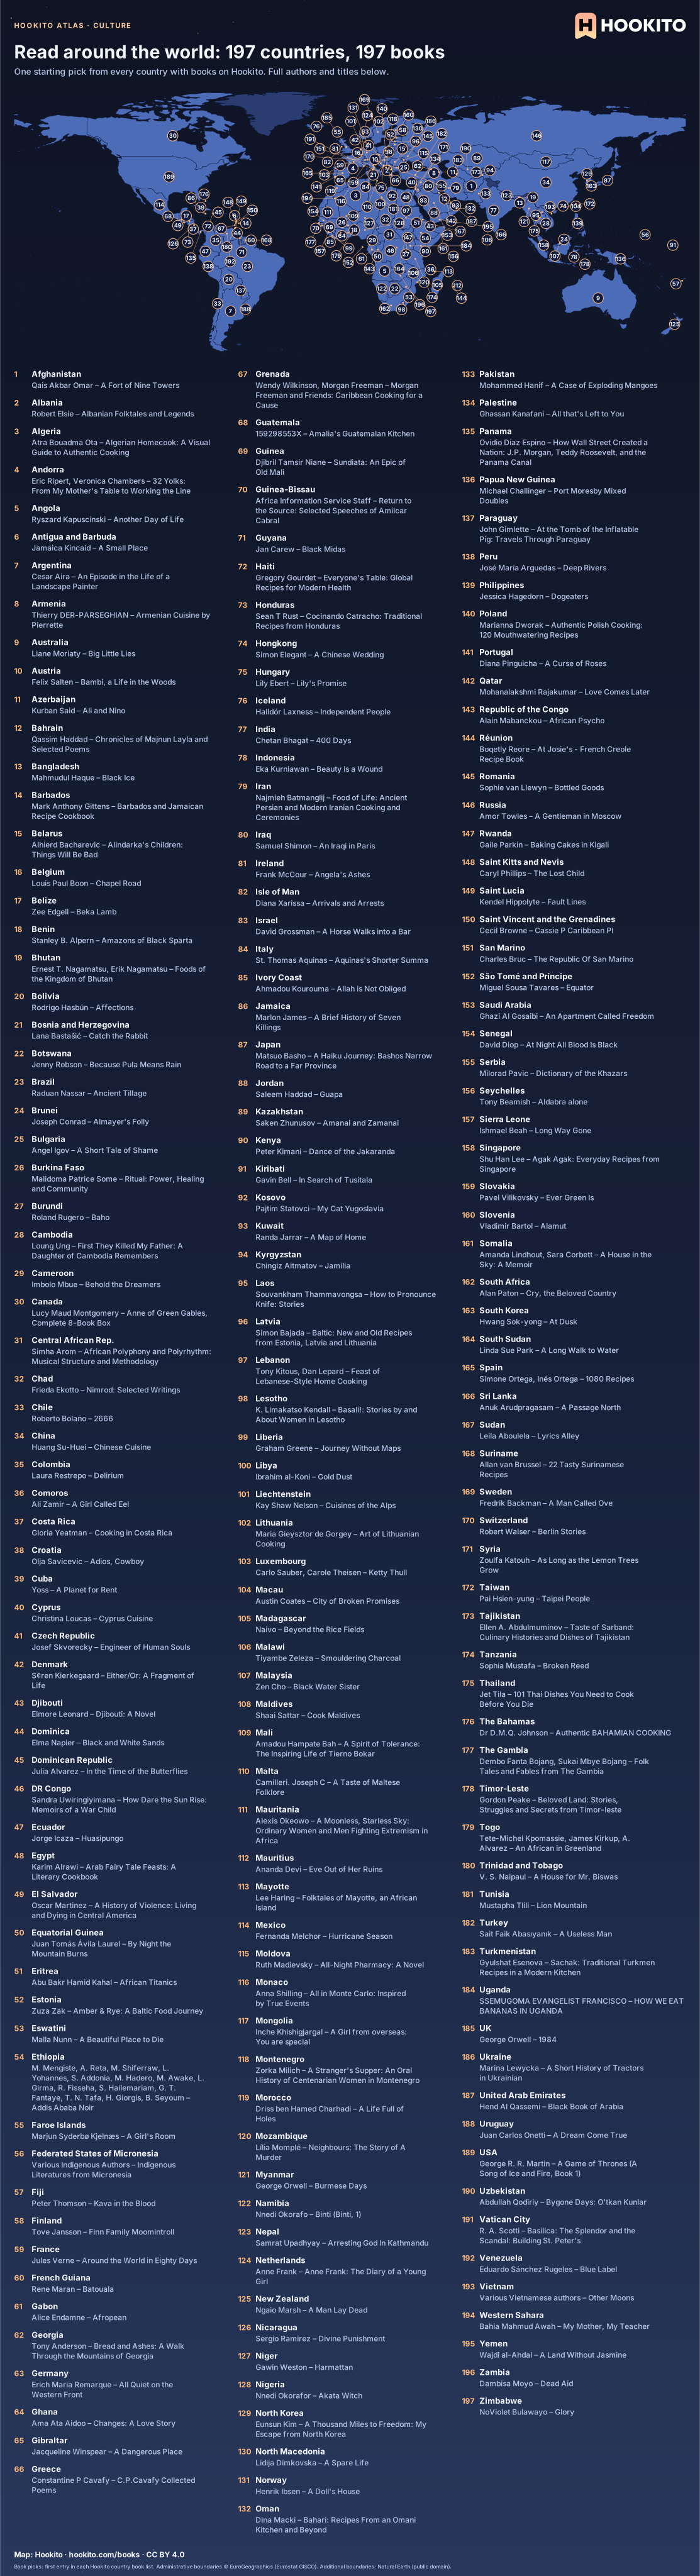
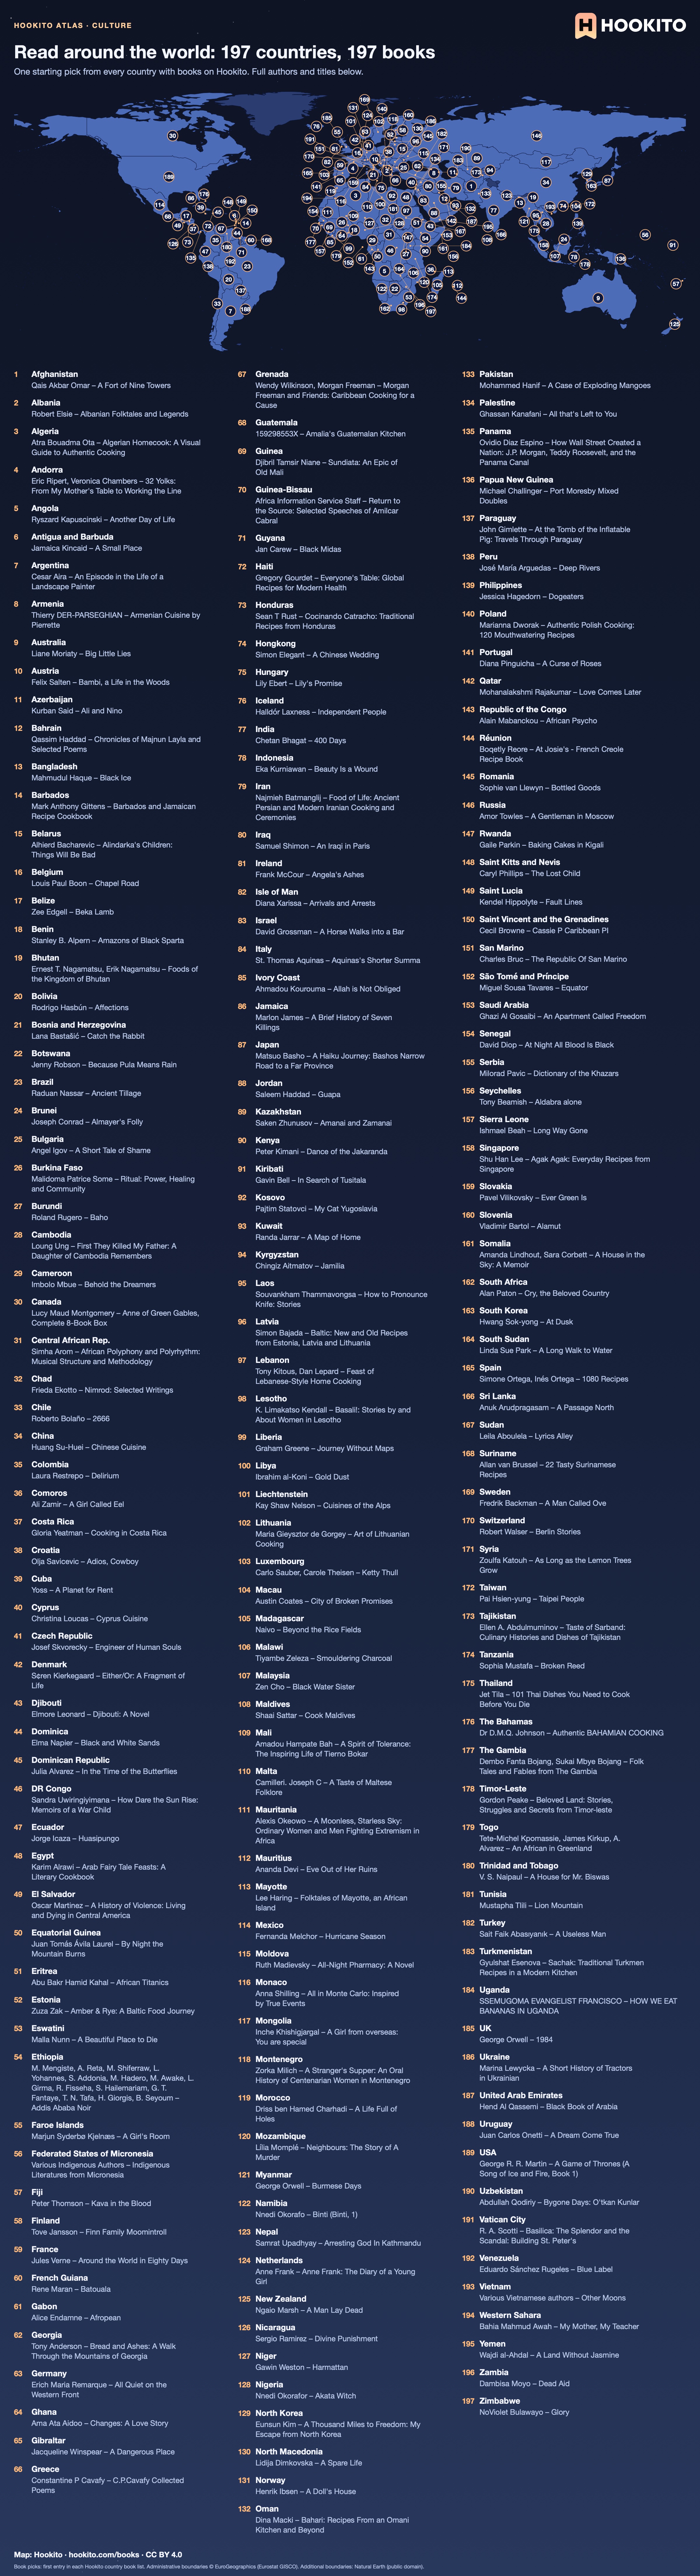
Read around the world: 197 countries, 197 books

World map with 197 numbered country markers, each linked to one book with its title and author in the alphabetic key below.

One starting book from each of Hookito’s 197 country book lists, using the first entry in each list. Match the numbered country to its author and title below, then open that country’s books page for the full entry and more choices.

Embed this map

Book picks: first entry in each Hookito country book list. Administrative boundaries © EuroGeographics (Eurostat GISCO). Additional boundaries: Natural Earth (public domain).

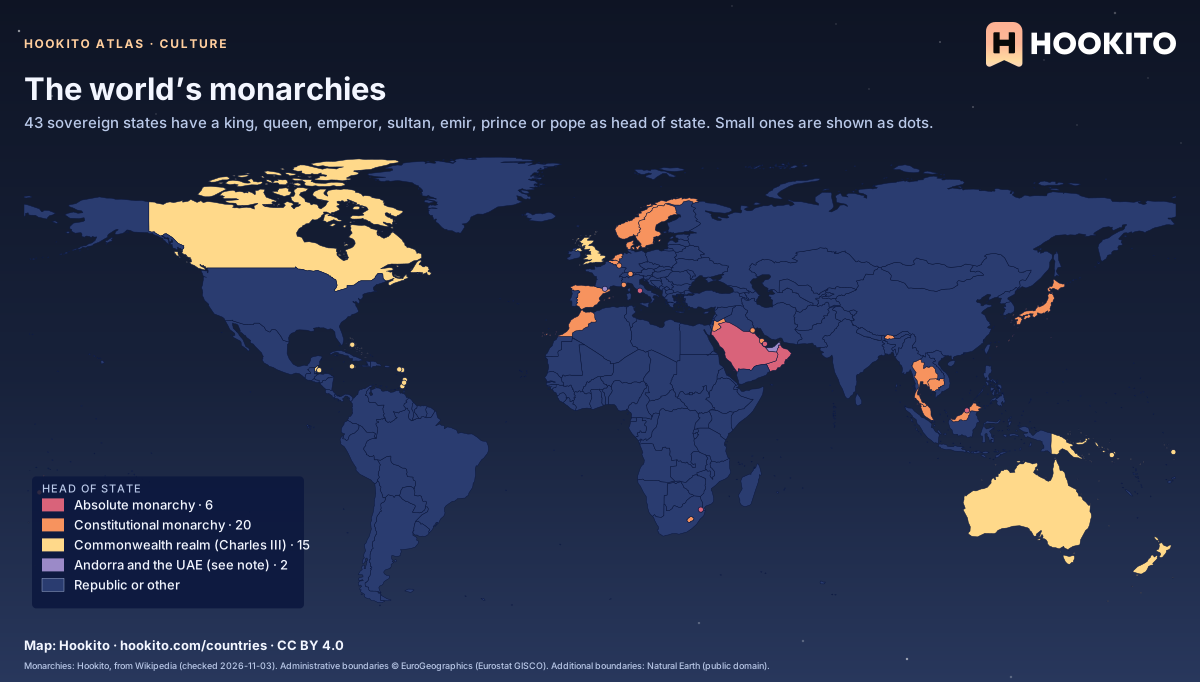
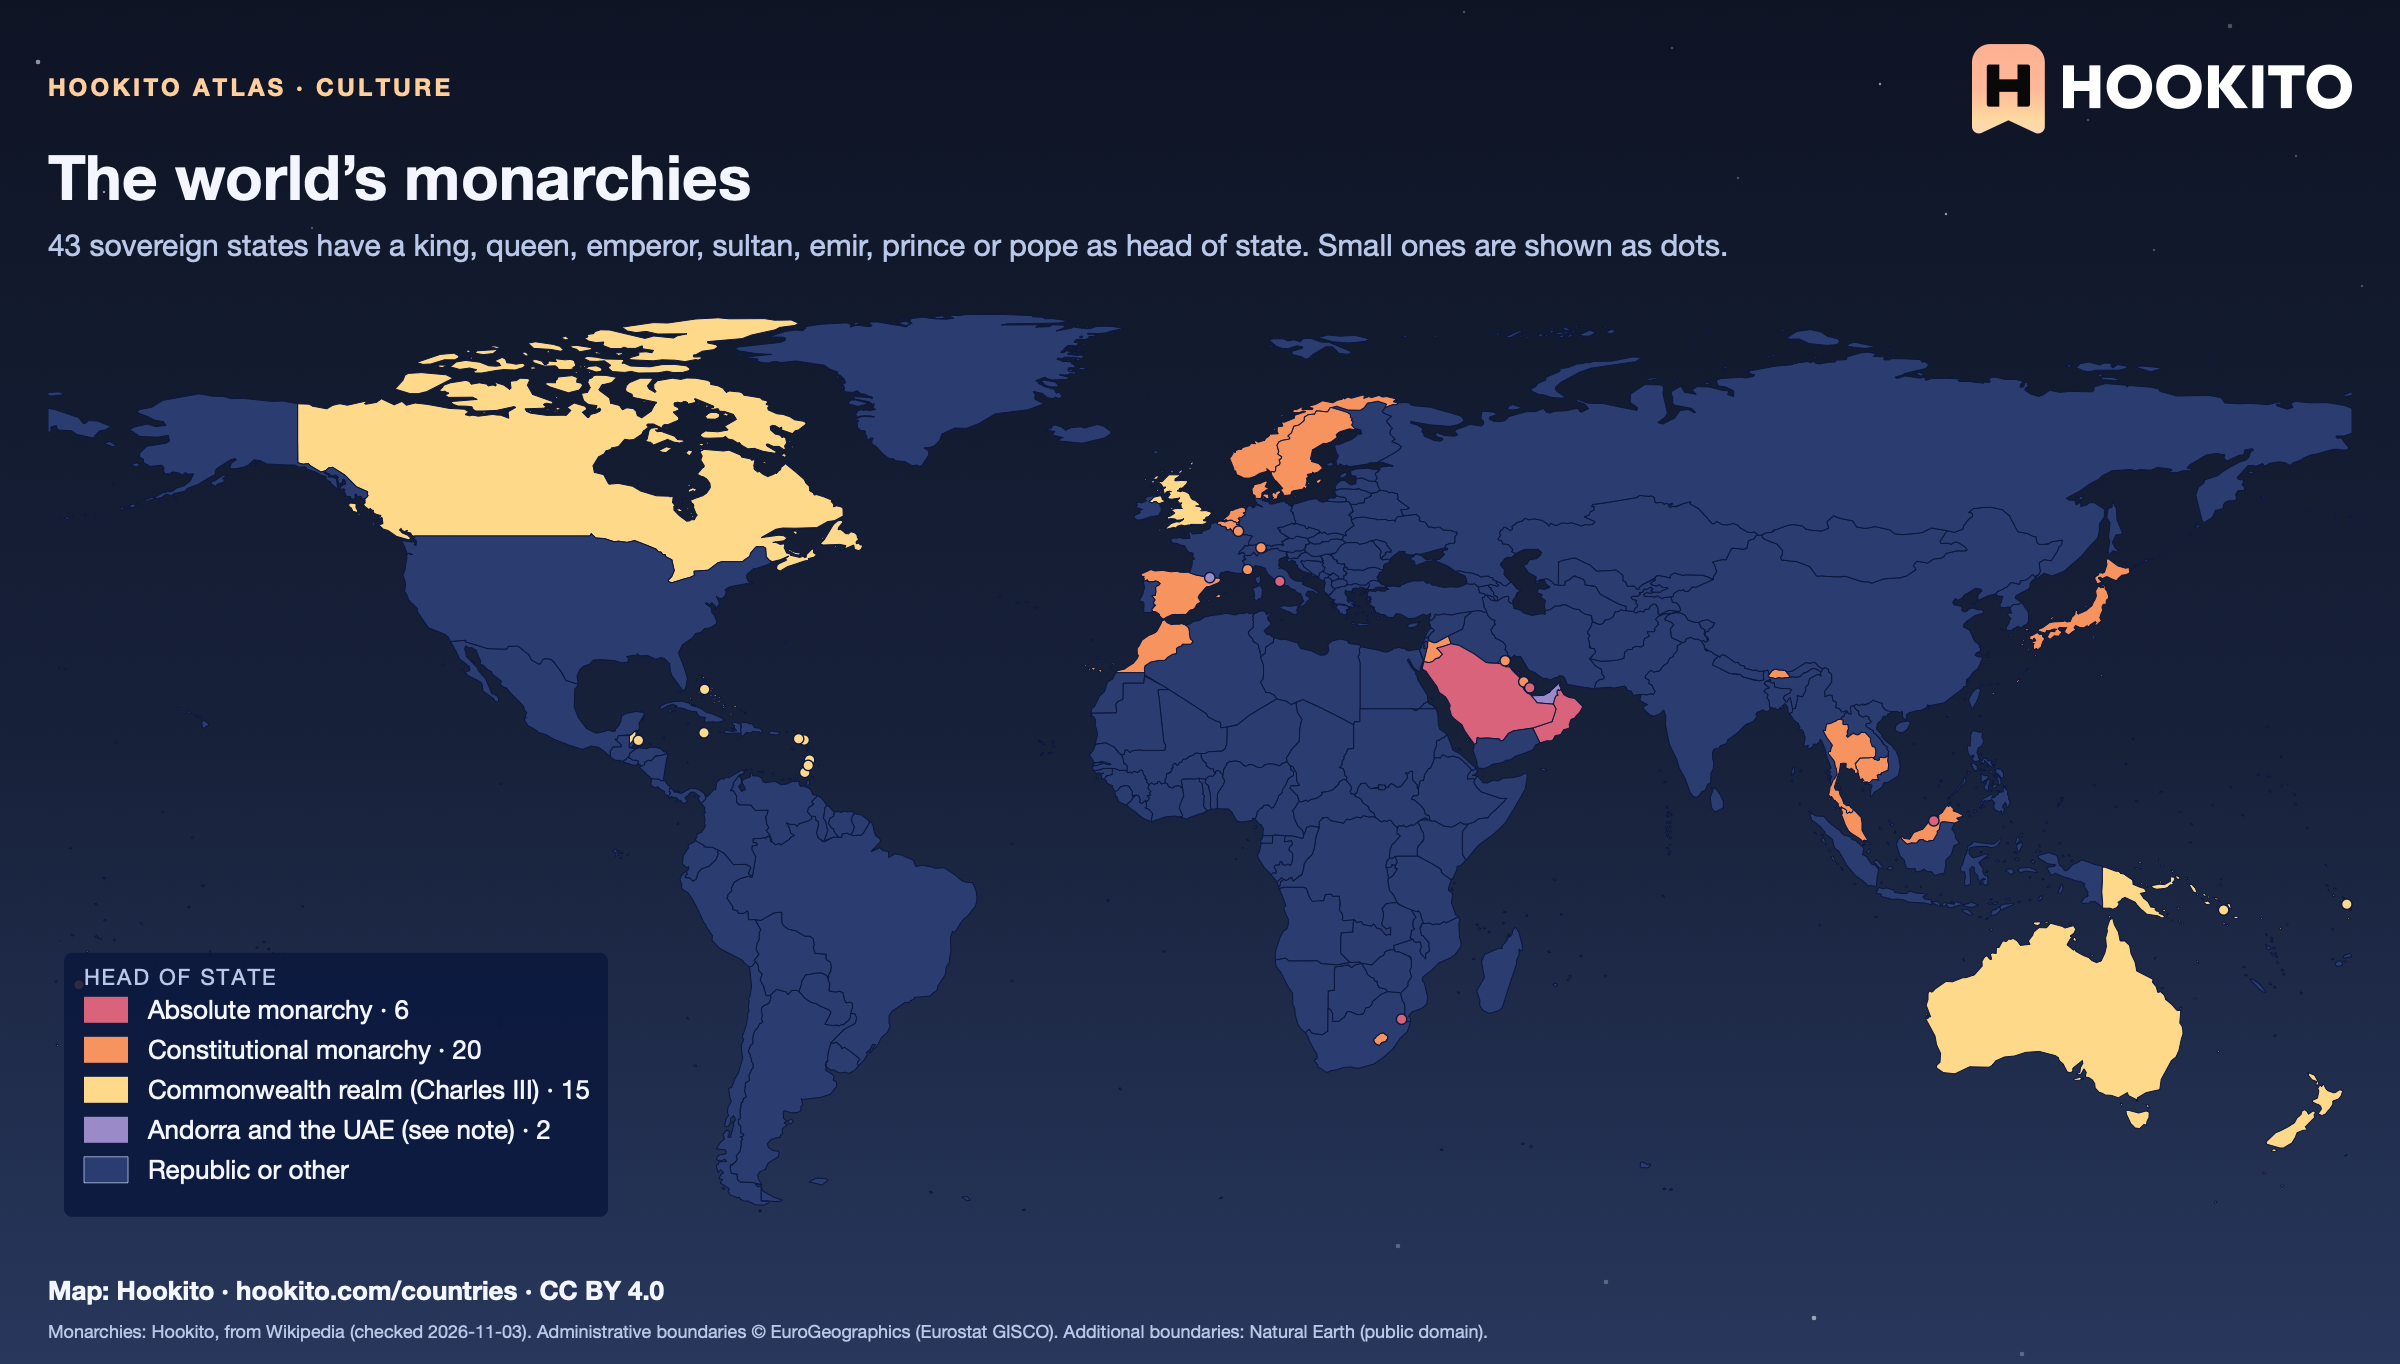
The world’s monarchies

World map of the 43 sovereign monarchies: absolute monarchies in red (mostly on the Arabian Peninsula), constitutional monarchies in orange (much of Western Europe, Japan, Thailand, Morocco), Commonwealth realms in yellow (UK, Canada, Australia, New Zealand and Caribbean and Pacific islands) and all other countries in dark blue.

Of the 43, 6 are absolute monarchies (Brunei, Oman, Qatar, Saudi Arabia, Eswatini and Vatican City), 20 constitutional ones, among them semi-constitutional states where the monarch keeps real power (Bahrain, Bhutan, Jordan, Liechtenstein, Monaco and Tonga), and 15 are Commonwealth realms that share King Charles III, the UK included. Andorra’s heads of state are two co-princes (France’s president and the Bishop of Urgell), and the UAE is a federation of seven hereditary emirates whose rulers elect the president, so both are shown apart. Dependent territories such as Greenland or Gibraltar are not counted.

Embed this map

Monarchies: Hookito, from Wikipedia (checked 2026-11-03). Administrative boundaries © EuroGeographics (Eurostat GISCO). Additional boundaries: Natural Earth (public domain).

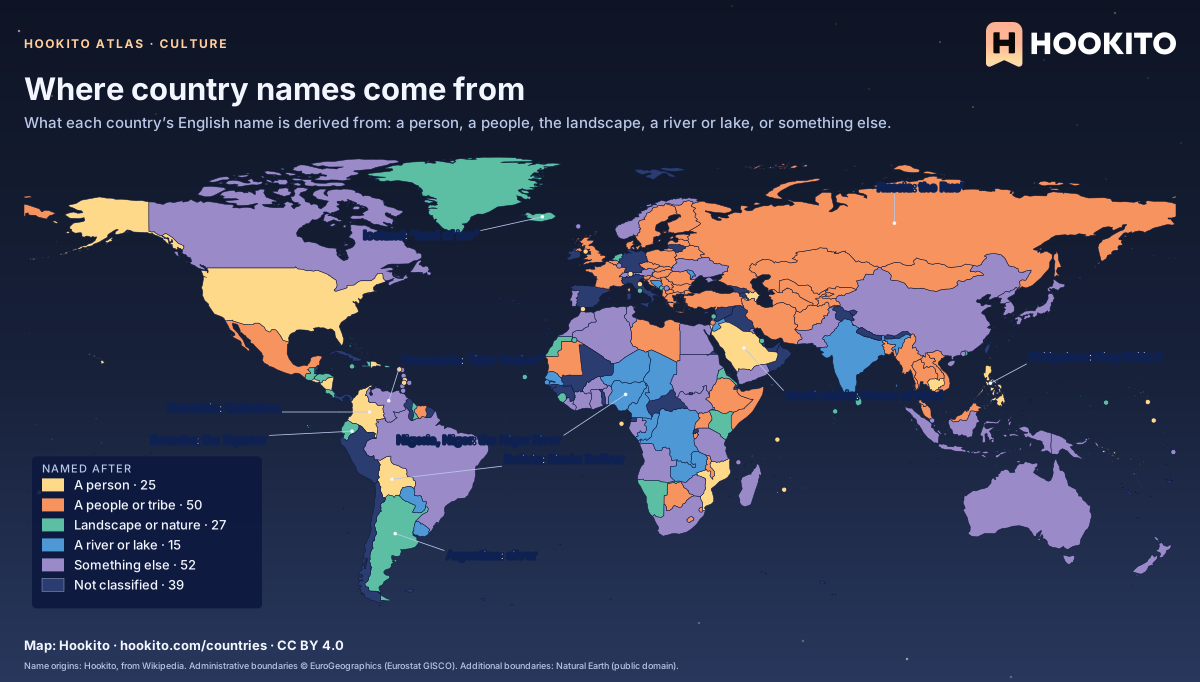
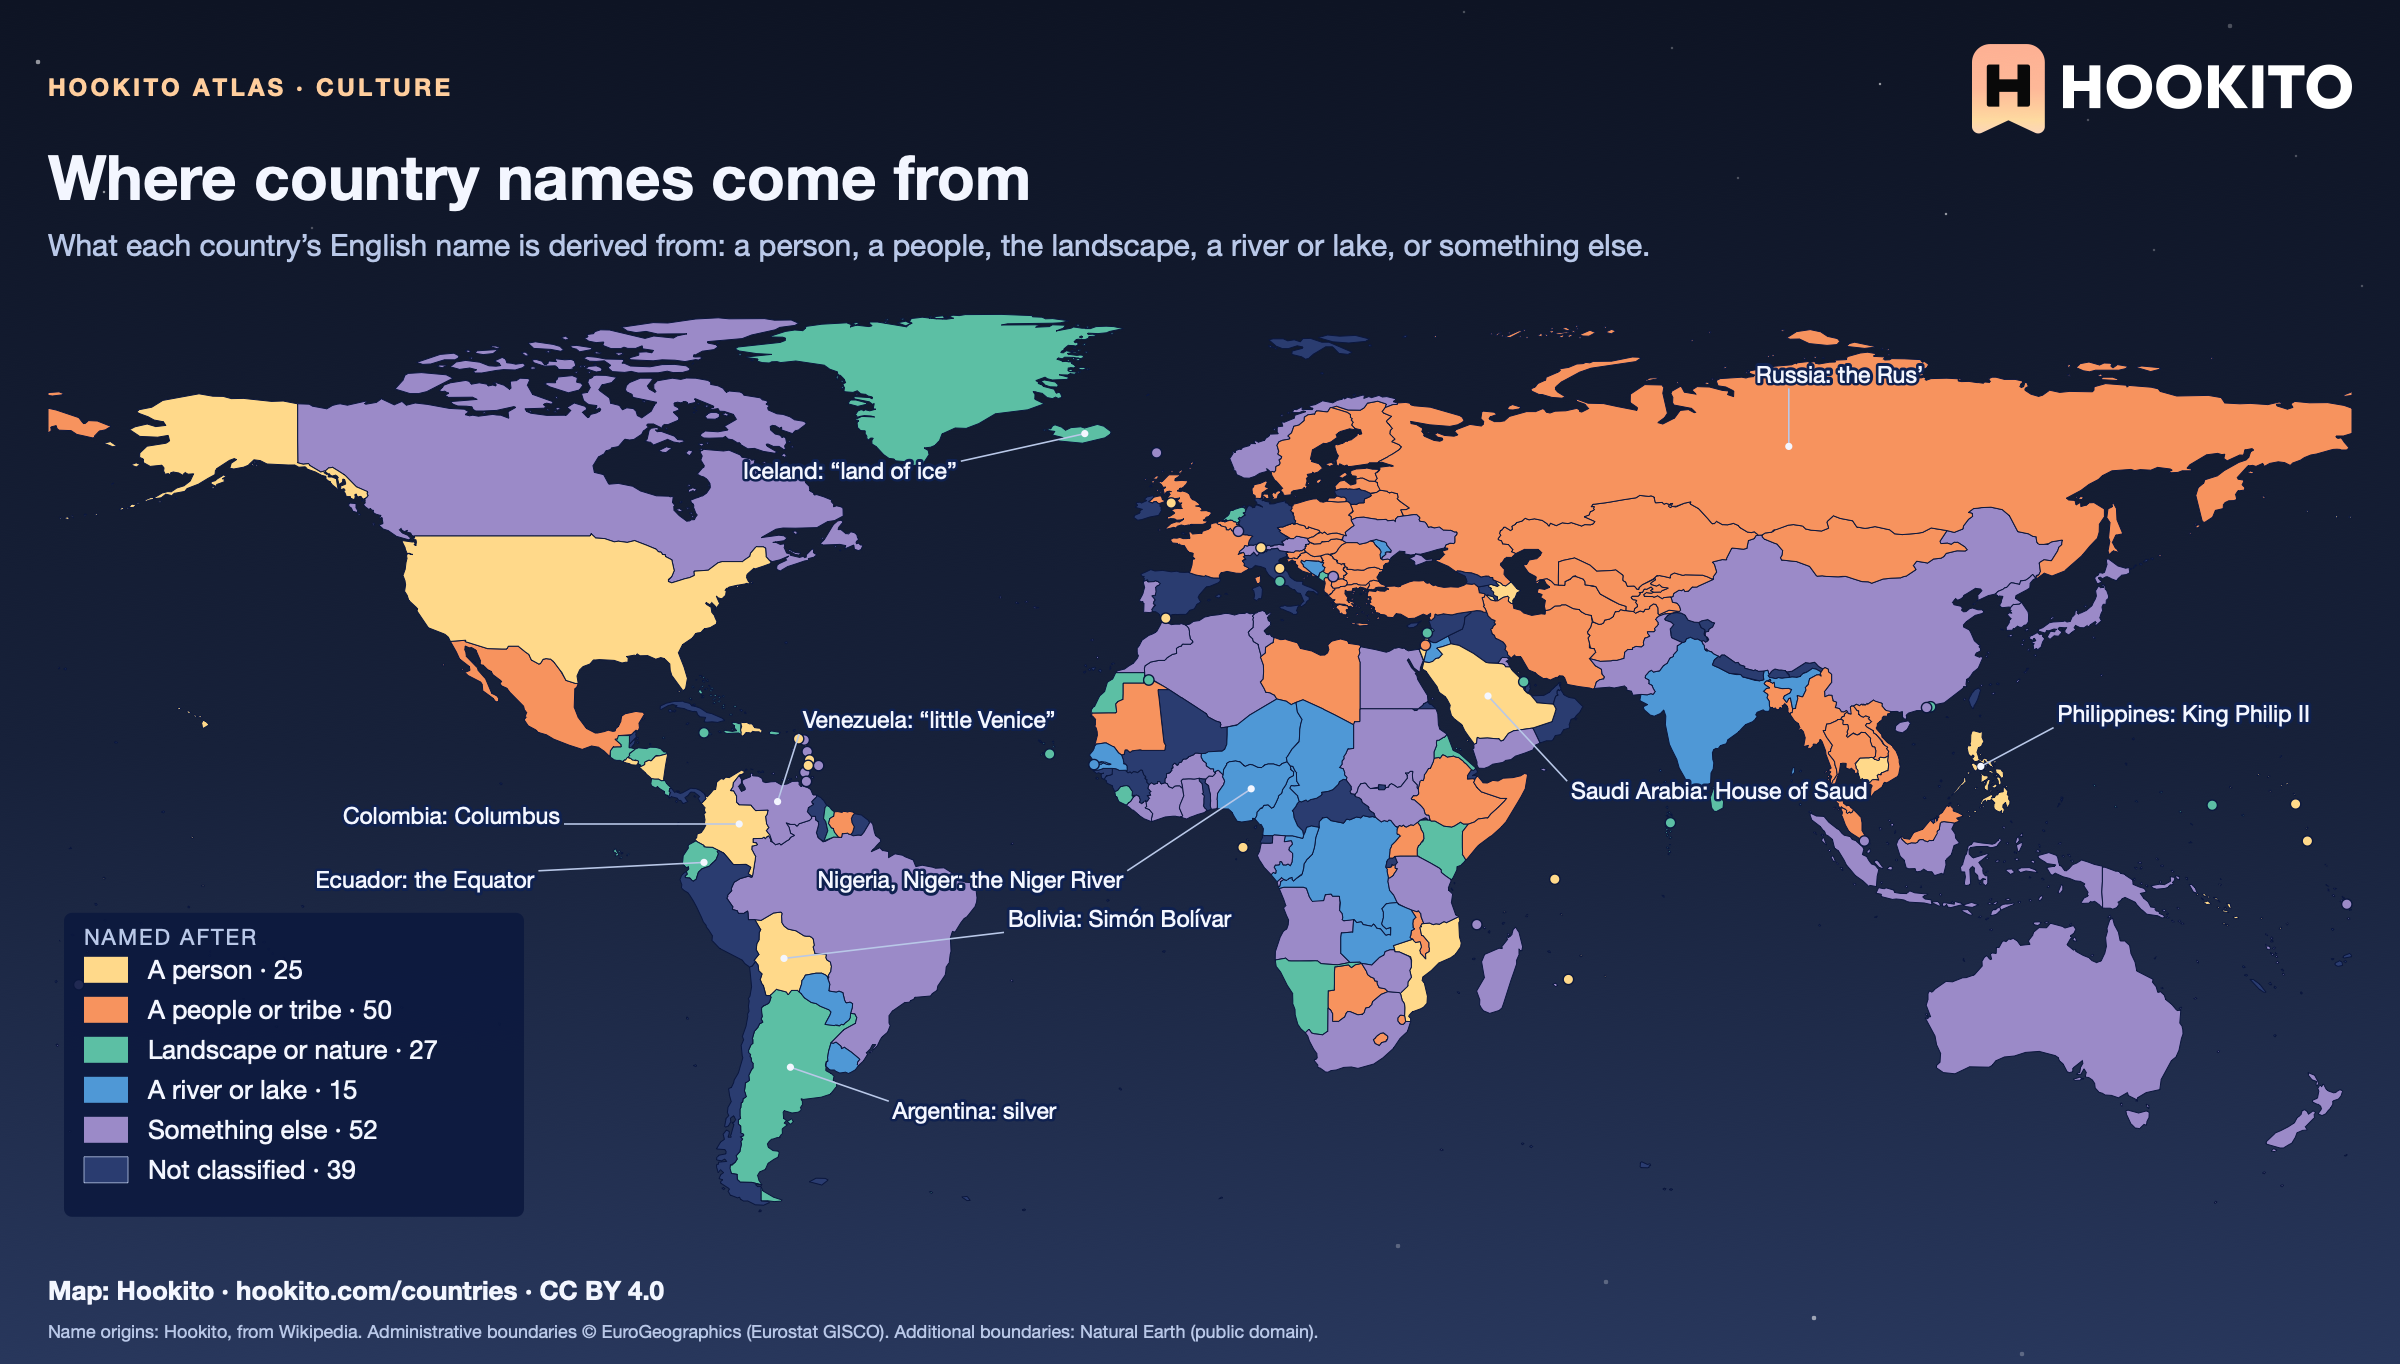
Where country names come from

World map colouring countries by the origin of their English name: people or tribes in orange across Europe, Africa and Central Asia, persons in yellow in the Americas, rivers in blue in Africa and South America, with labelled examples such as Bolivia after Simón Bolívar and the Philippines after King Philip II.

50 names come from a people or tribe, 25 from a person (Bolívar, Columbus, Philip II, the House of Saud), 27 from the landscape and 15 from a river or lake. 39 countries are left unclassified, most of them because the origin of their name is uncertain or disputed, such as Spain, Italy and Germany. Several readings are debated by scholars; the map follows the standard etymologies.

Embed this map

Name origins: Hookito, from Wikipedia. Administrative boundaries © EuroGeographics (Eurostat GISCO). Additional boundaries: Natural Earth (public domain).

3 maps

Flags

Every country painted in its own flag, and the colours flags share.

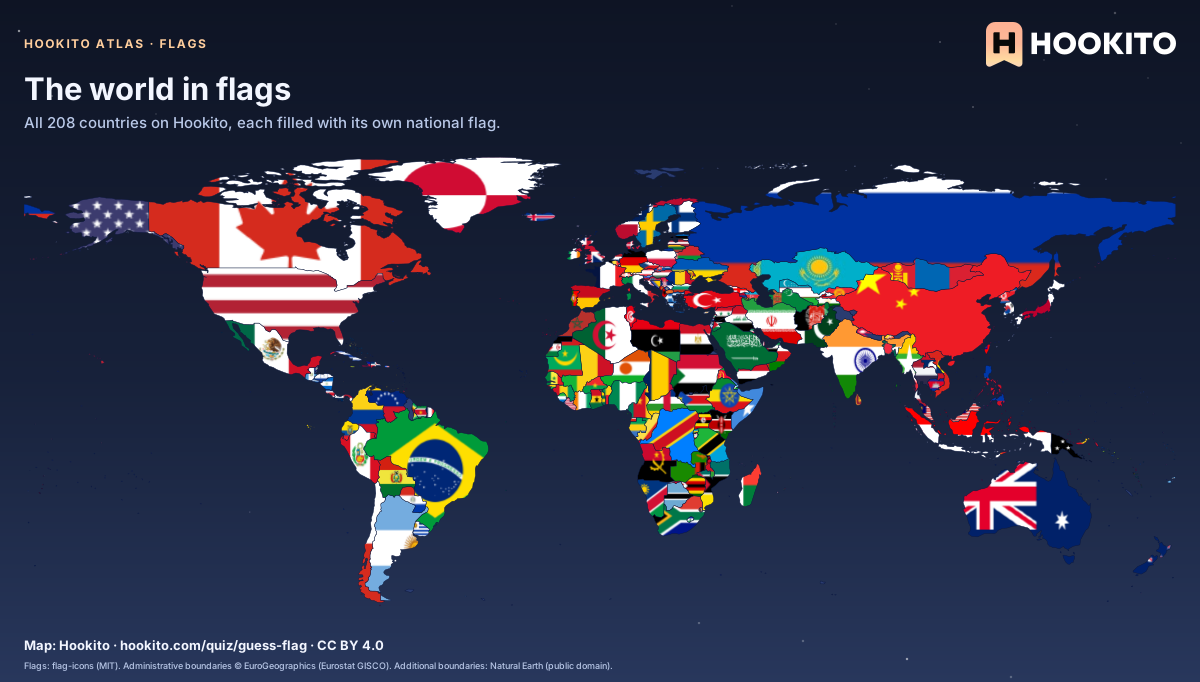
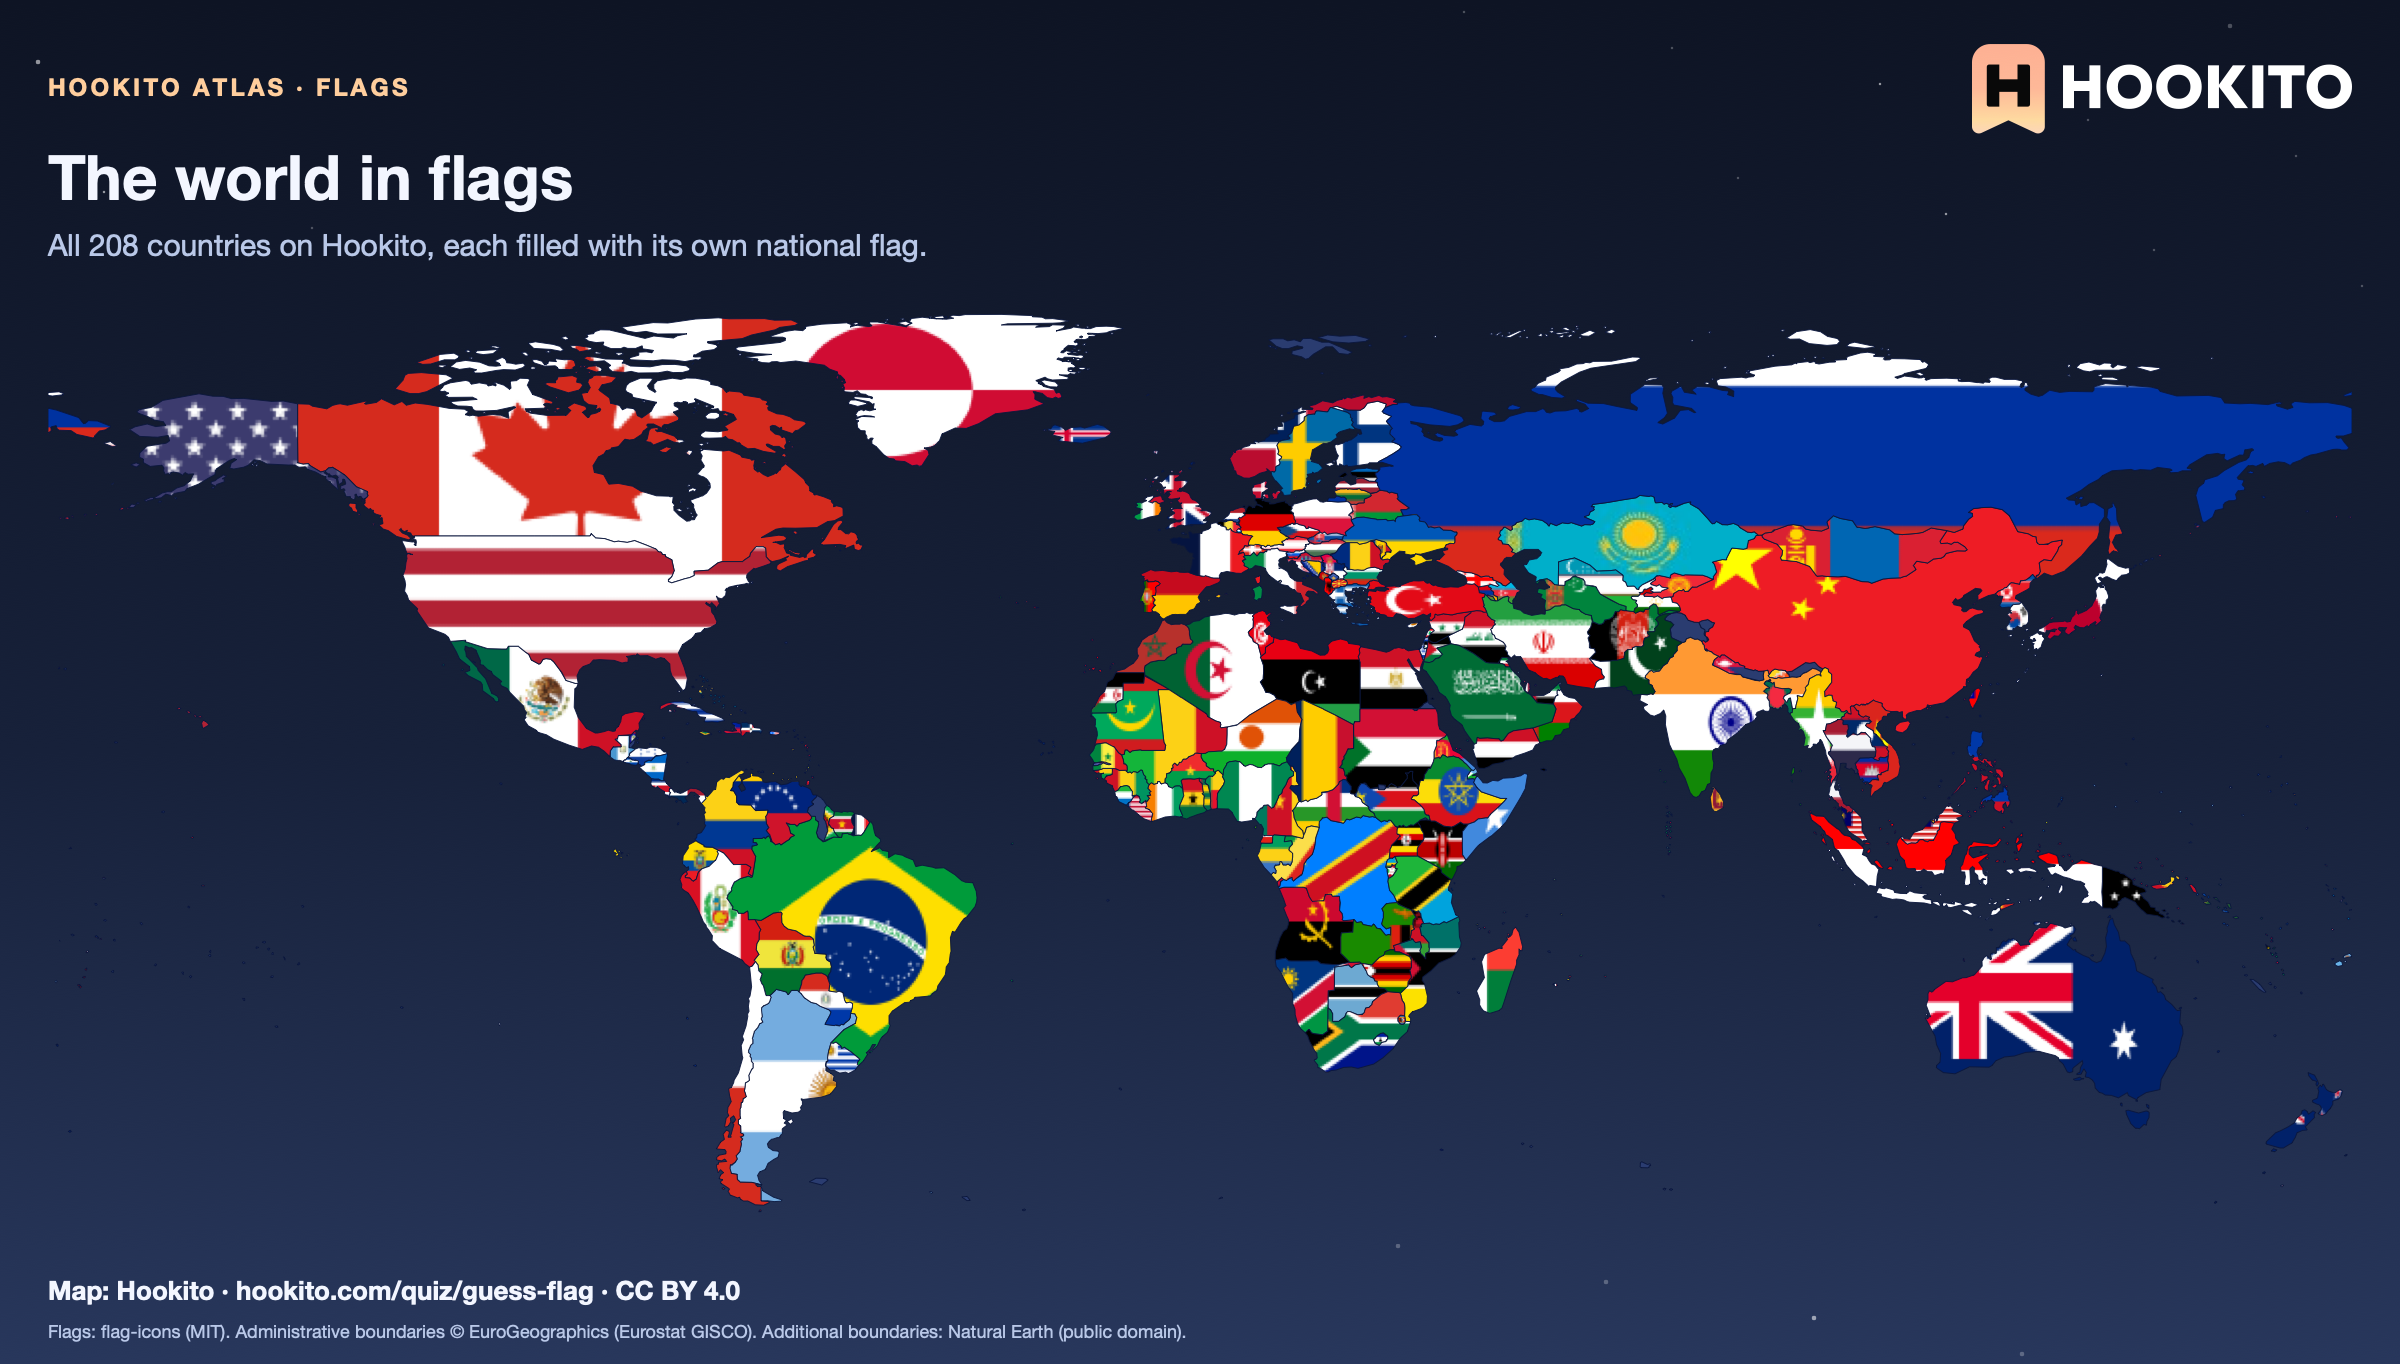
The world in flags

Dark world map in which every country is filled with its national flag, from the Maple Leaf across Canada to the Southern Cross over Australia.

Each flag is fitted to the country’s main landmass, partly cropped and slightly stretched, so long or narrow countries such as Chile or Russia show only part of theirs. Very small countries are only a few pixels wide at this scale.

Embed this map

Flags: flag-icons (MIT). Administrative boundaries © EuroGeographics (Eurostat GISCO). Additional boundaries: Natural Earth (public domain).

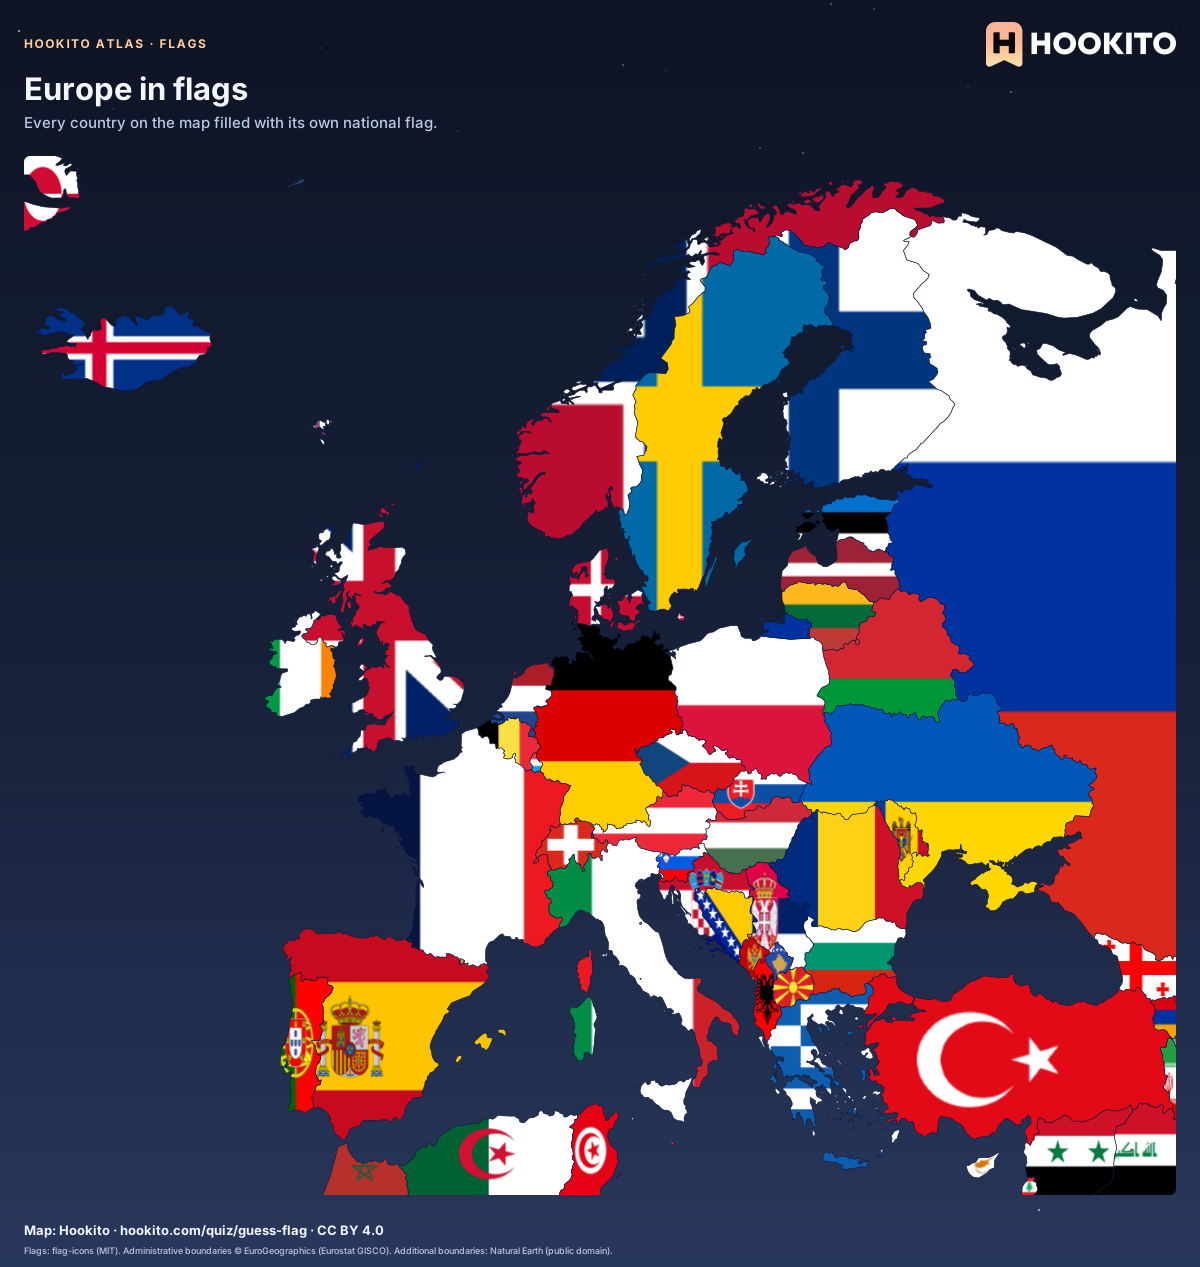
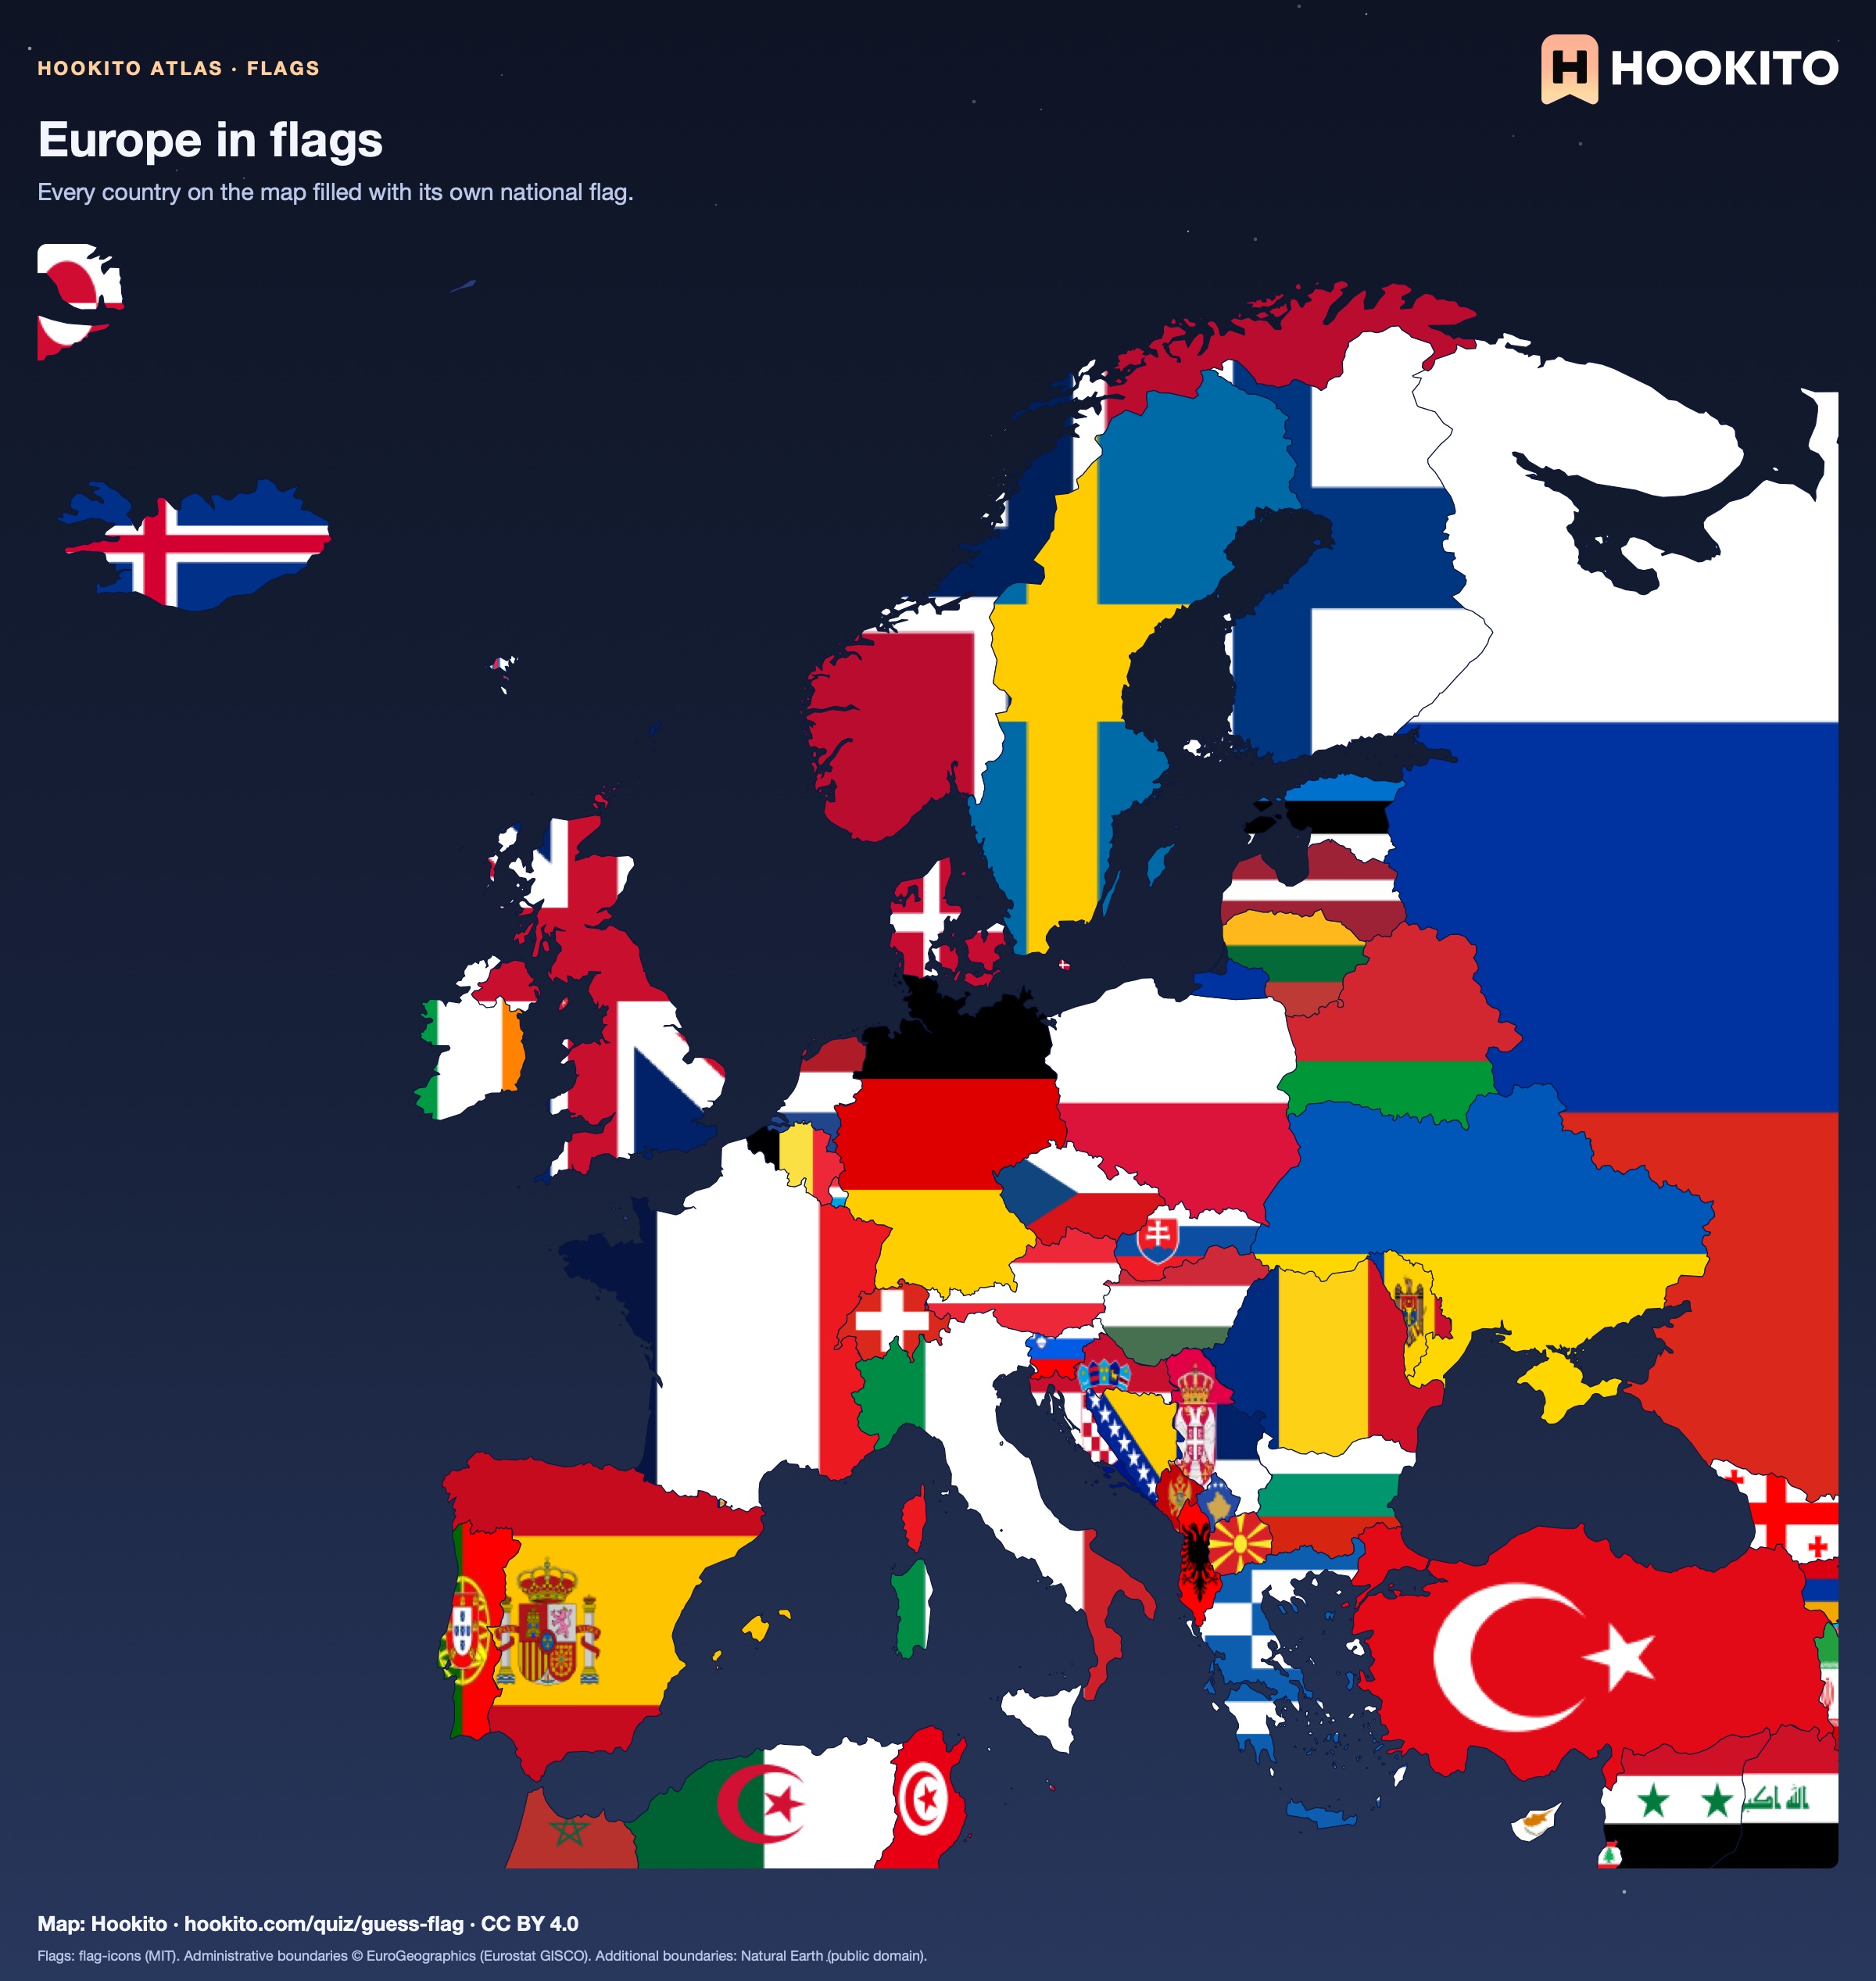
Europe in flags

Dark map of Europe and its neighbours in which every country is filled with its national flag, from Iceland and Portugal to western Russia and Turkey.

Each flag is fitted to the country’s main landmass on this map, partly cropped and slightly stretched, so narrow shapes such as Norway or Italy show only part of theirs. Russia is cut off at 45° east; Turkey, the Caucasus and the North African coast keep their flags too, so no land is left blank.

Embed this map

Flags: flag-icons (MIT). Administrative boundaries © EuroGeographics (Eurostat GISCO). Additional boundaries: Natural Earth (public domain).

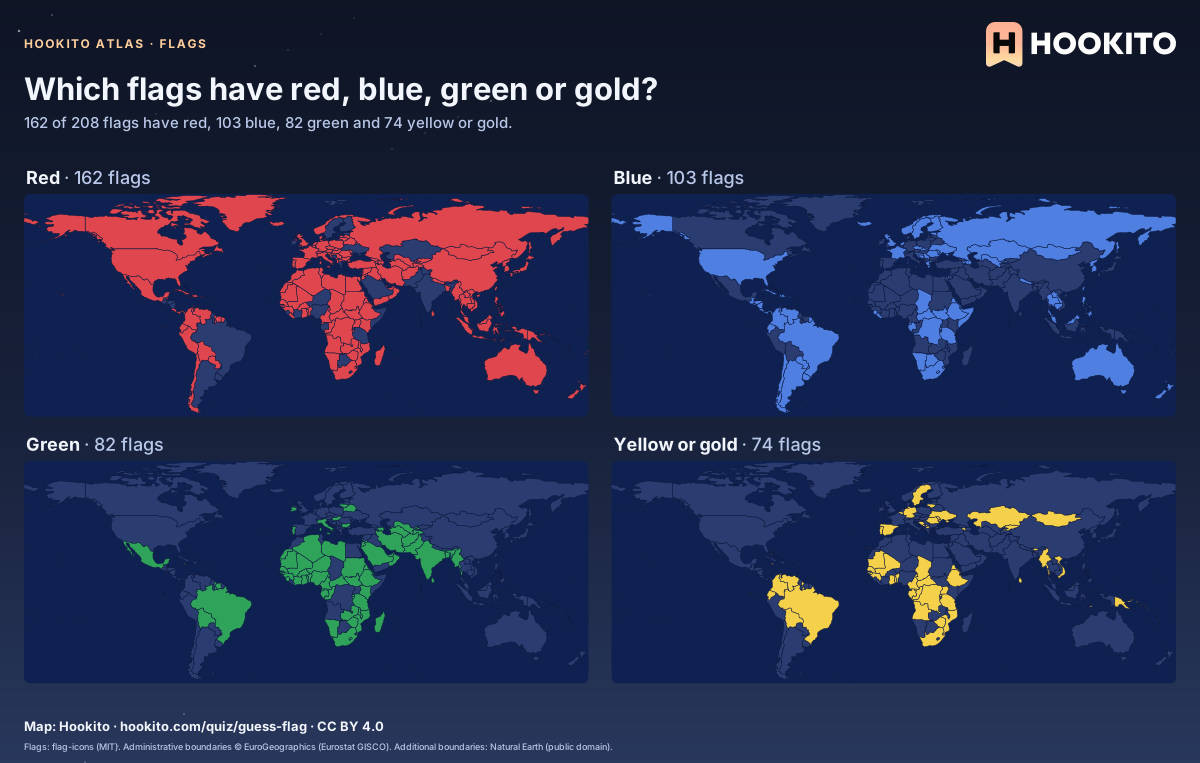
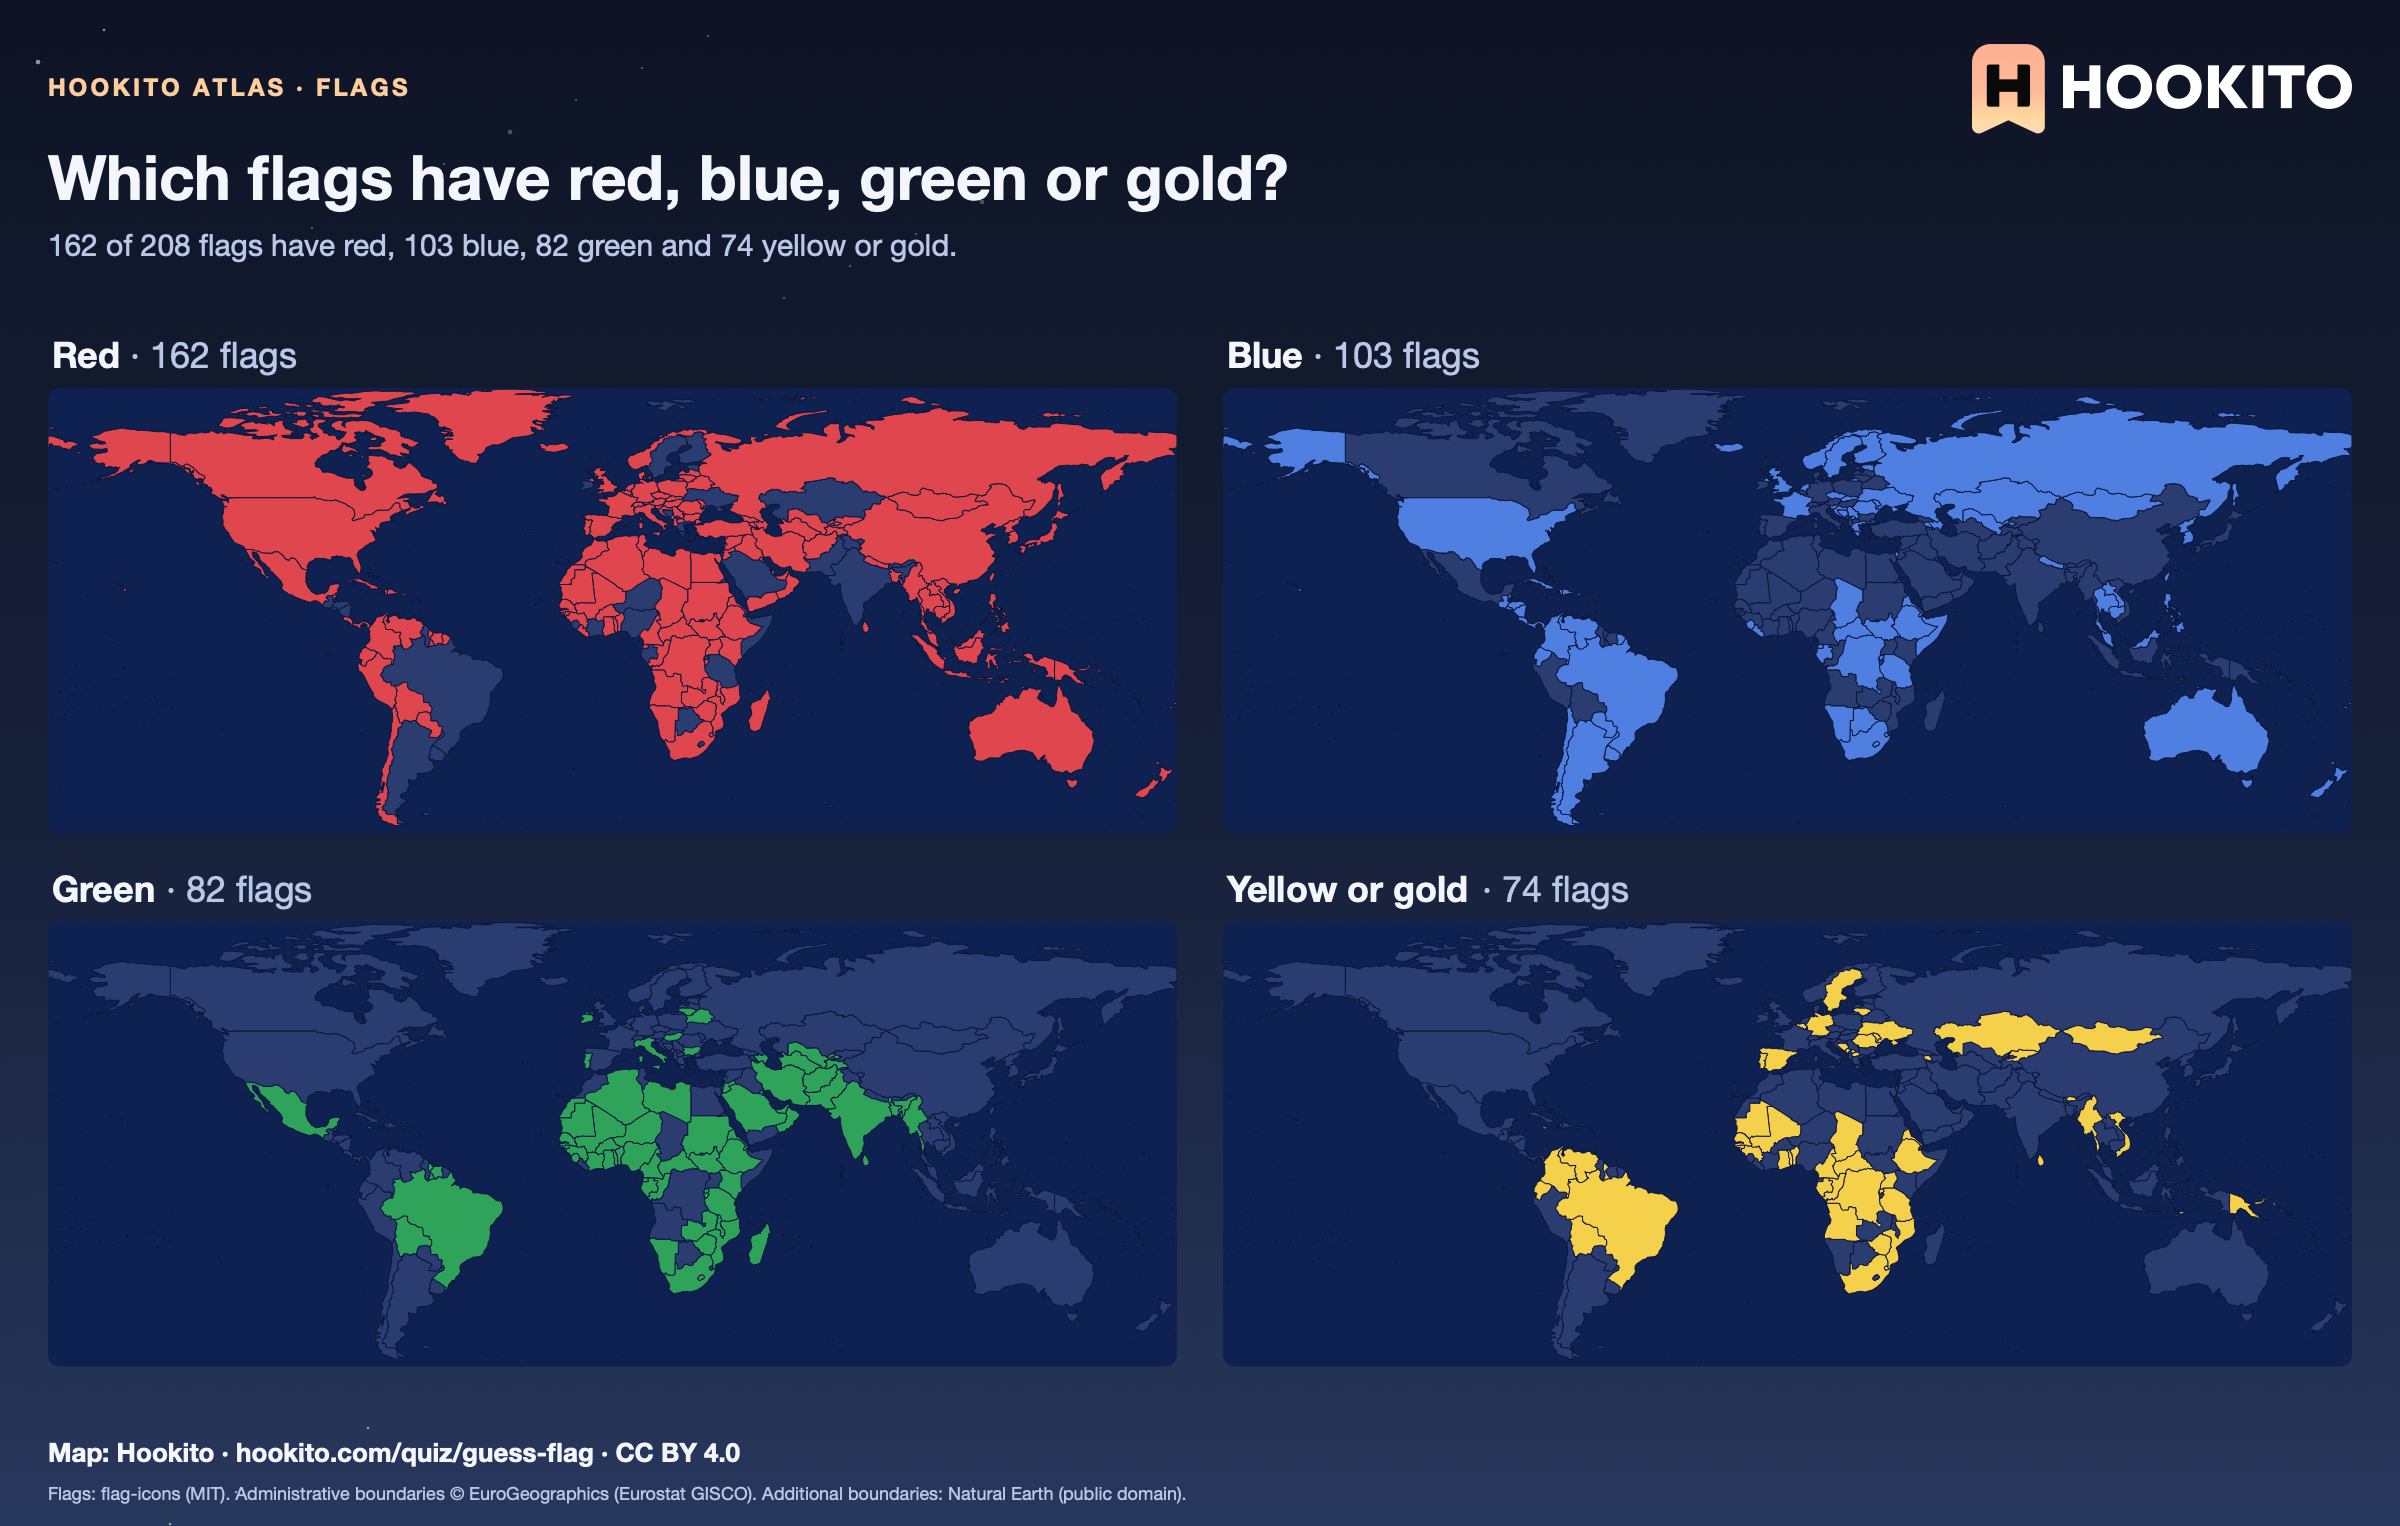
Which flags have red, blue, green or gold?

Four small world maps highlighting the countries whose flags contain red (162), blue (103), green (82) and yellow or gold (74).

Red is the most common flag colour: 162 of 208 flags have it. A flag counts as having a colour when it covers at least 4% of the flag, measured by matching every pixel of the rendered flag to the nearest named colour; navy and light blue both count as blue, maroon as red, and small details of a coat of arms do not count.

Embed this map

Flags: flag-icons (MIT). Administrative boundaries © EuroGeographics (Eurostat GISCO). Additional boundaries: Natural Earth (public domain).

Reusing the maps

You’re welcome to share, print or adapt these maps. The renderings are licensed CC BY 4.0: credit them as “Map: Hookito, hookito.com”, with a link to this page where you can.

The underlying data keeps its own terms, so keep its credits too. Administrative boundaries © EuroGeographics (Eurostat GISCO), which also applies to most country outlines. Additional boundaries are from Natural Earth (public domain). Each map lists its other sources: Wikidata and GeoNames for country facts, Our World in Data for the statistics, Unicode CLDR and the IANA time zone database for the calendar and clock maps, flag-icons (MIT) for the flags, Wikimedia Commons for the paintings, NASA Earth Observatory for the night imagery. The maps are offered as finished images only; the boundary data itself isn’t available for download here.

Where to next?

Back to the globe
Hookito landscape illustration