Hookito

The Hookito atlas

People maps: population and everyday life

All world maps →

Explore population, median age, life expectancy, wealth, migration, life satisfaction and internet access around the world.

About these maps

The collection brings together data Hookito already uses: the capitals and facts behind the country pages, the outlines from the countries list, the paintings in Art, the album lists in Audio and the night side of the globe. The boundaries combine Eurostat GISCO and Natural Earth data. The world maps use a plain equirectangular projection, cropped at 84° north and 58° south; the continent and Europe maps are zoomed from more detailed boundaries.

Spotted a mistake? Write to submissions@hookito.com.

11 maps

People

Population, age, health, wealth, migration and internet access around the world.

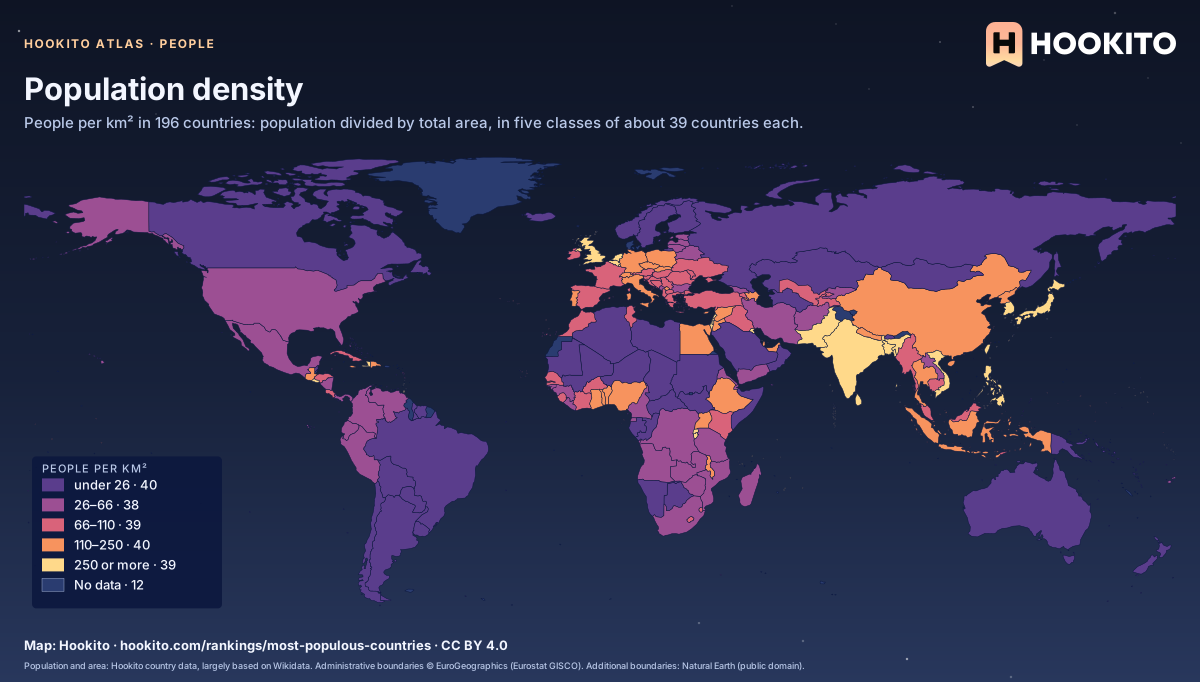
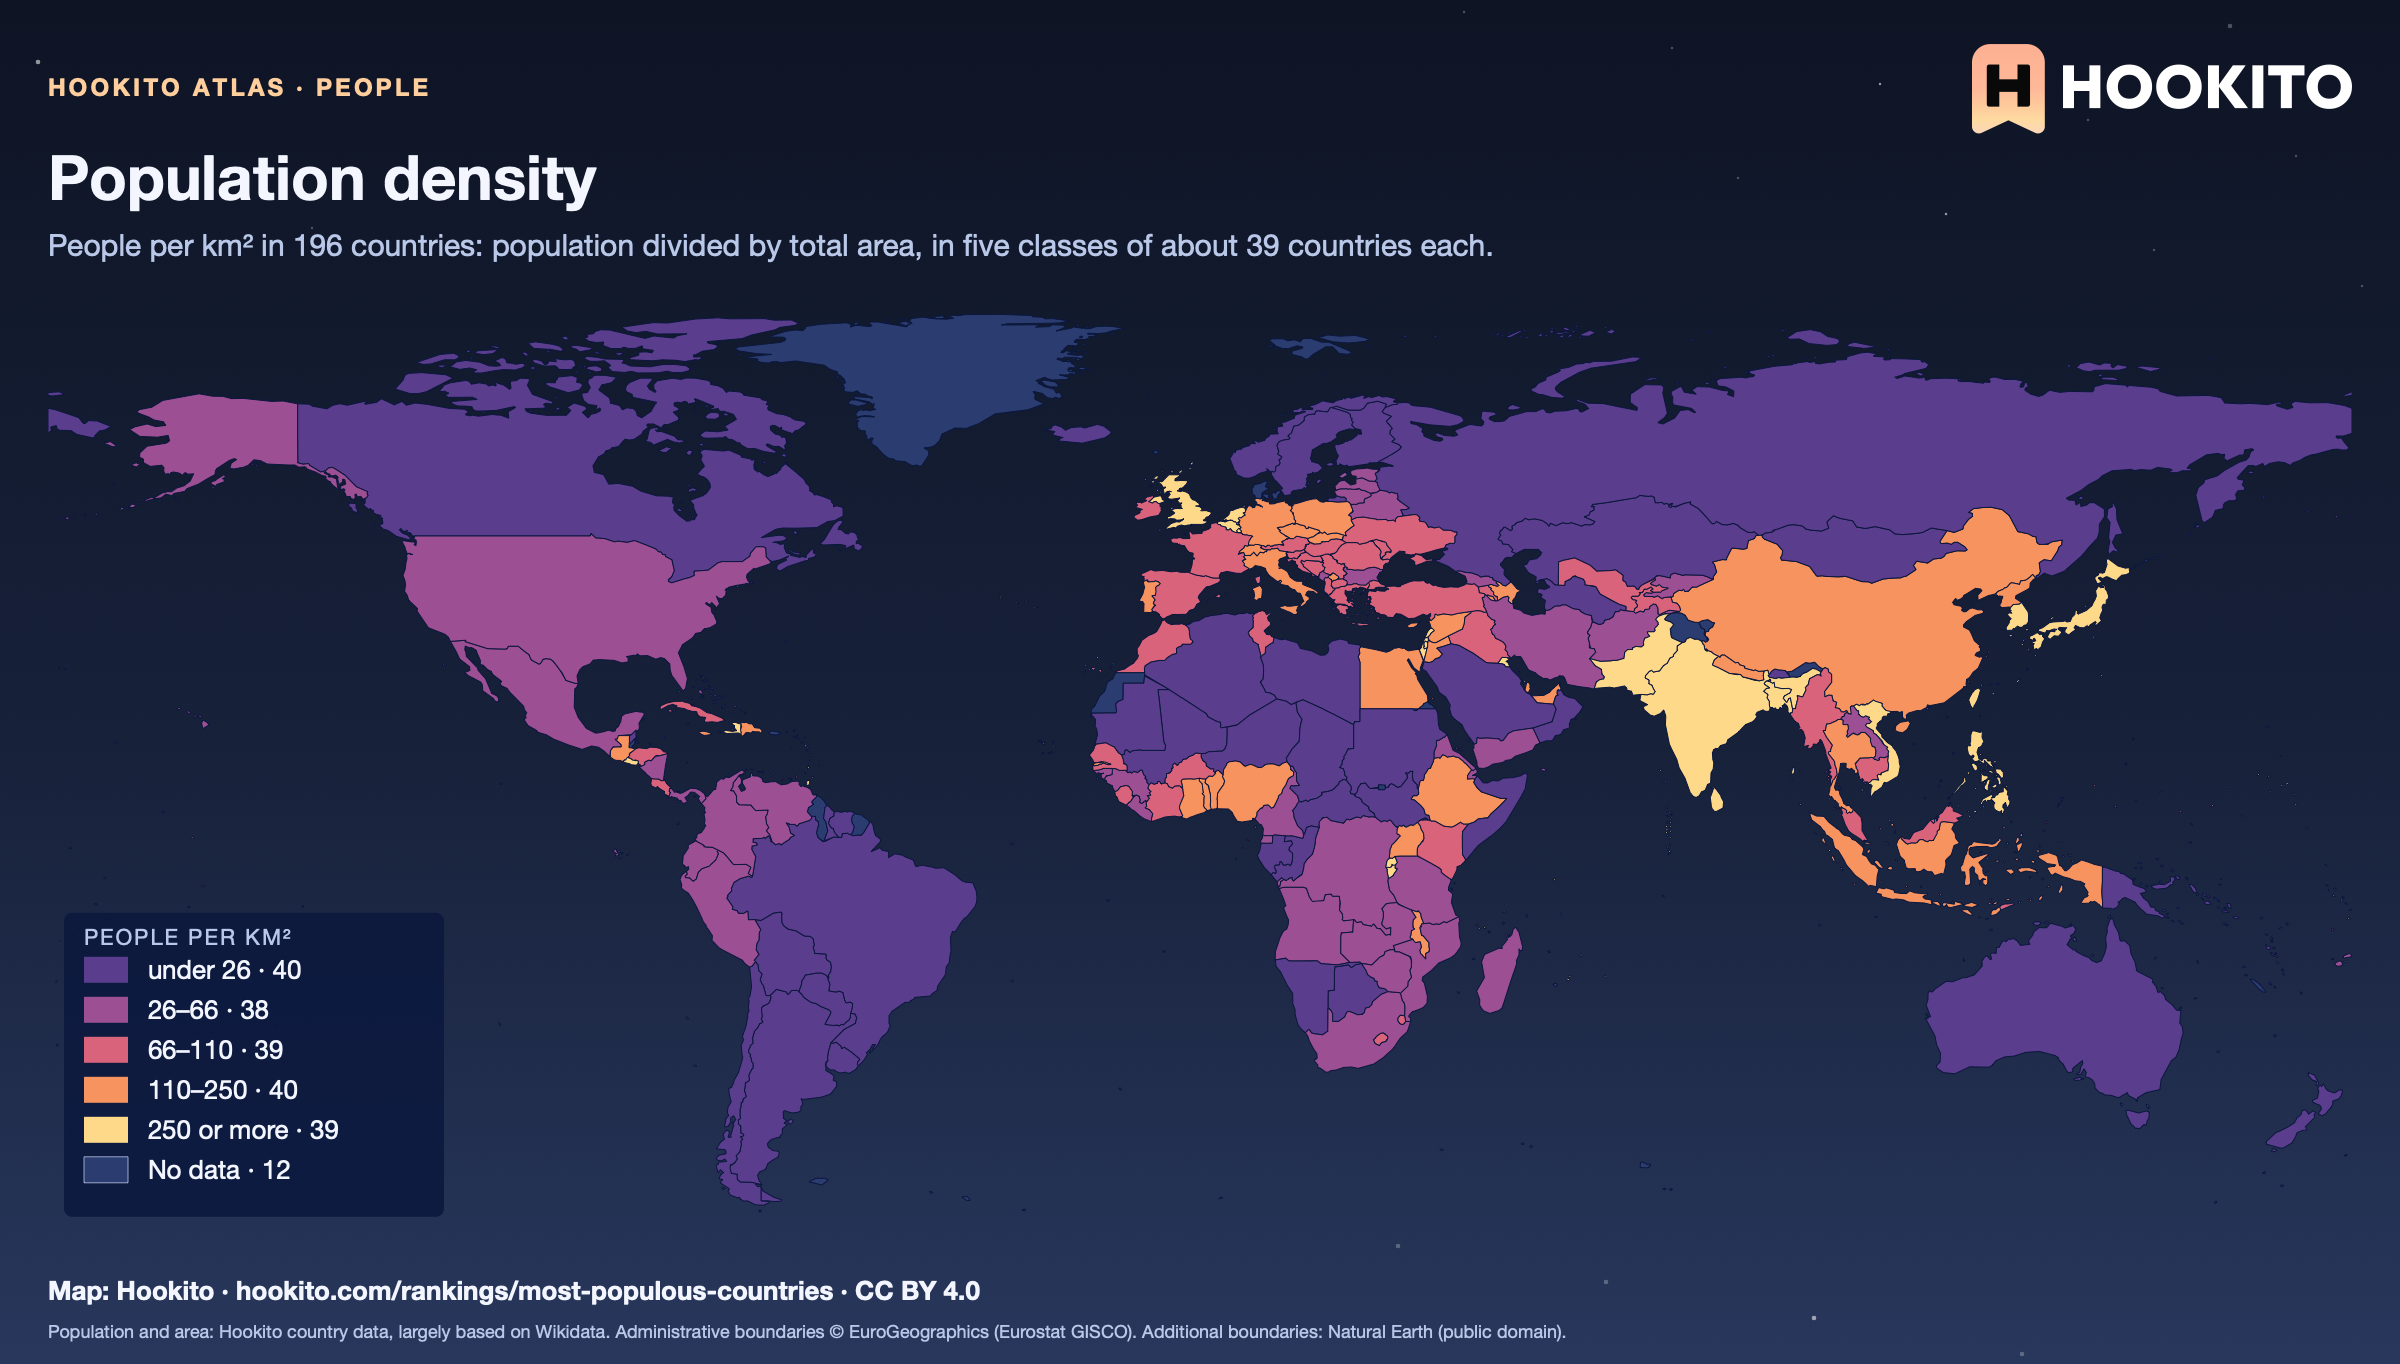
Population density

World choropleth of population density in five classes from purple (fewest people per km²) to pale yellow (most); India, Bangladesh, Japan and the UK are among the brightest, Mongolia, Australia and Canada among the darkest.

Monaco is the most densely populated (19,212 people per km²) and Mongolia the least (2.2). Of the larger countries, Bangladesh leads with 1,162. The figure spreads people over the whole area, deserts and ice included. 12 countries without a population or area figure stay grey.

Embed this map

Population and area: Hookito country data, largely based on Wikidata. Administrative boundaries © EuroGeographics (Eurostat GISCO). Additional boundaries: Natural Earth (public domain).
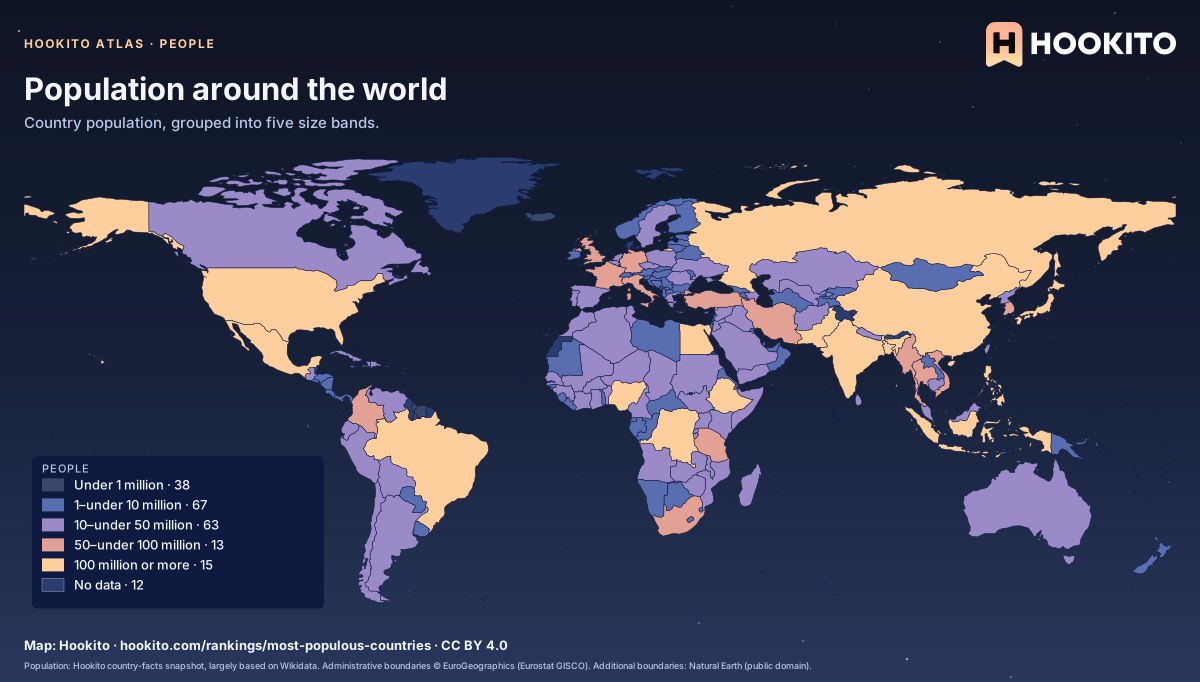
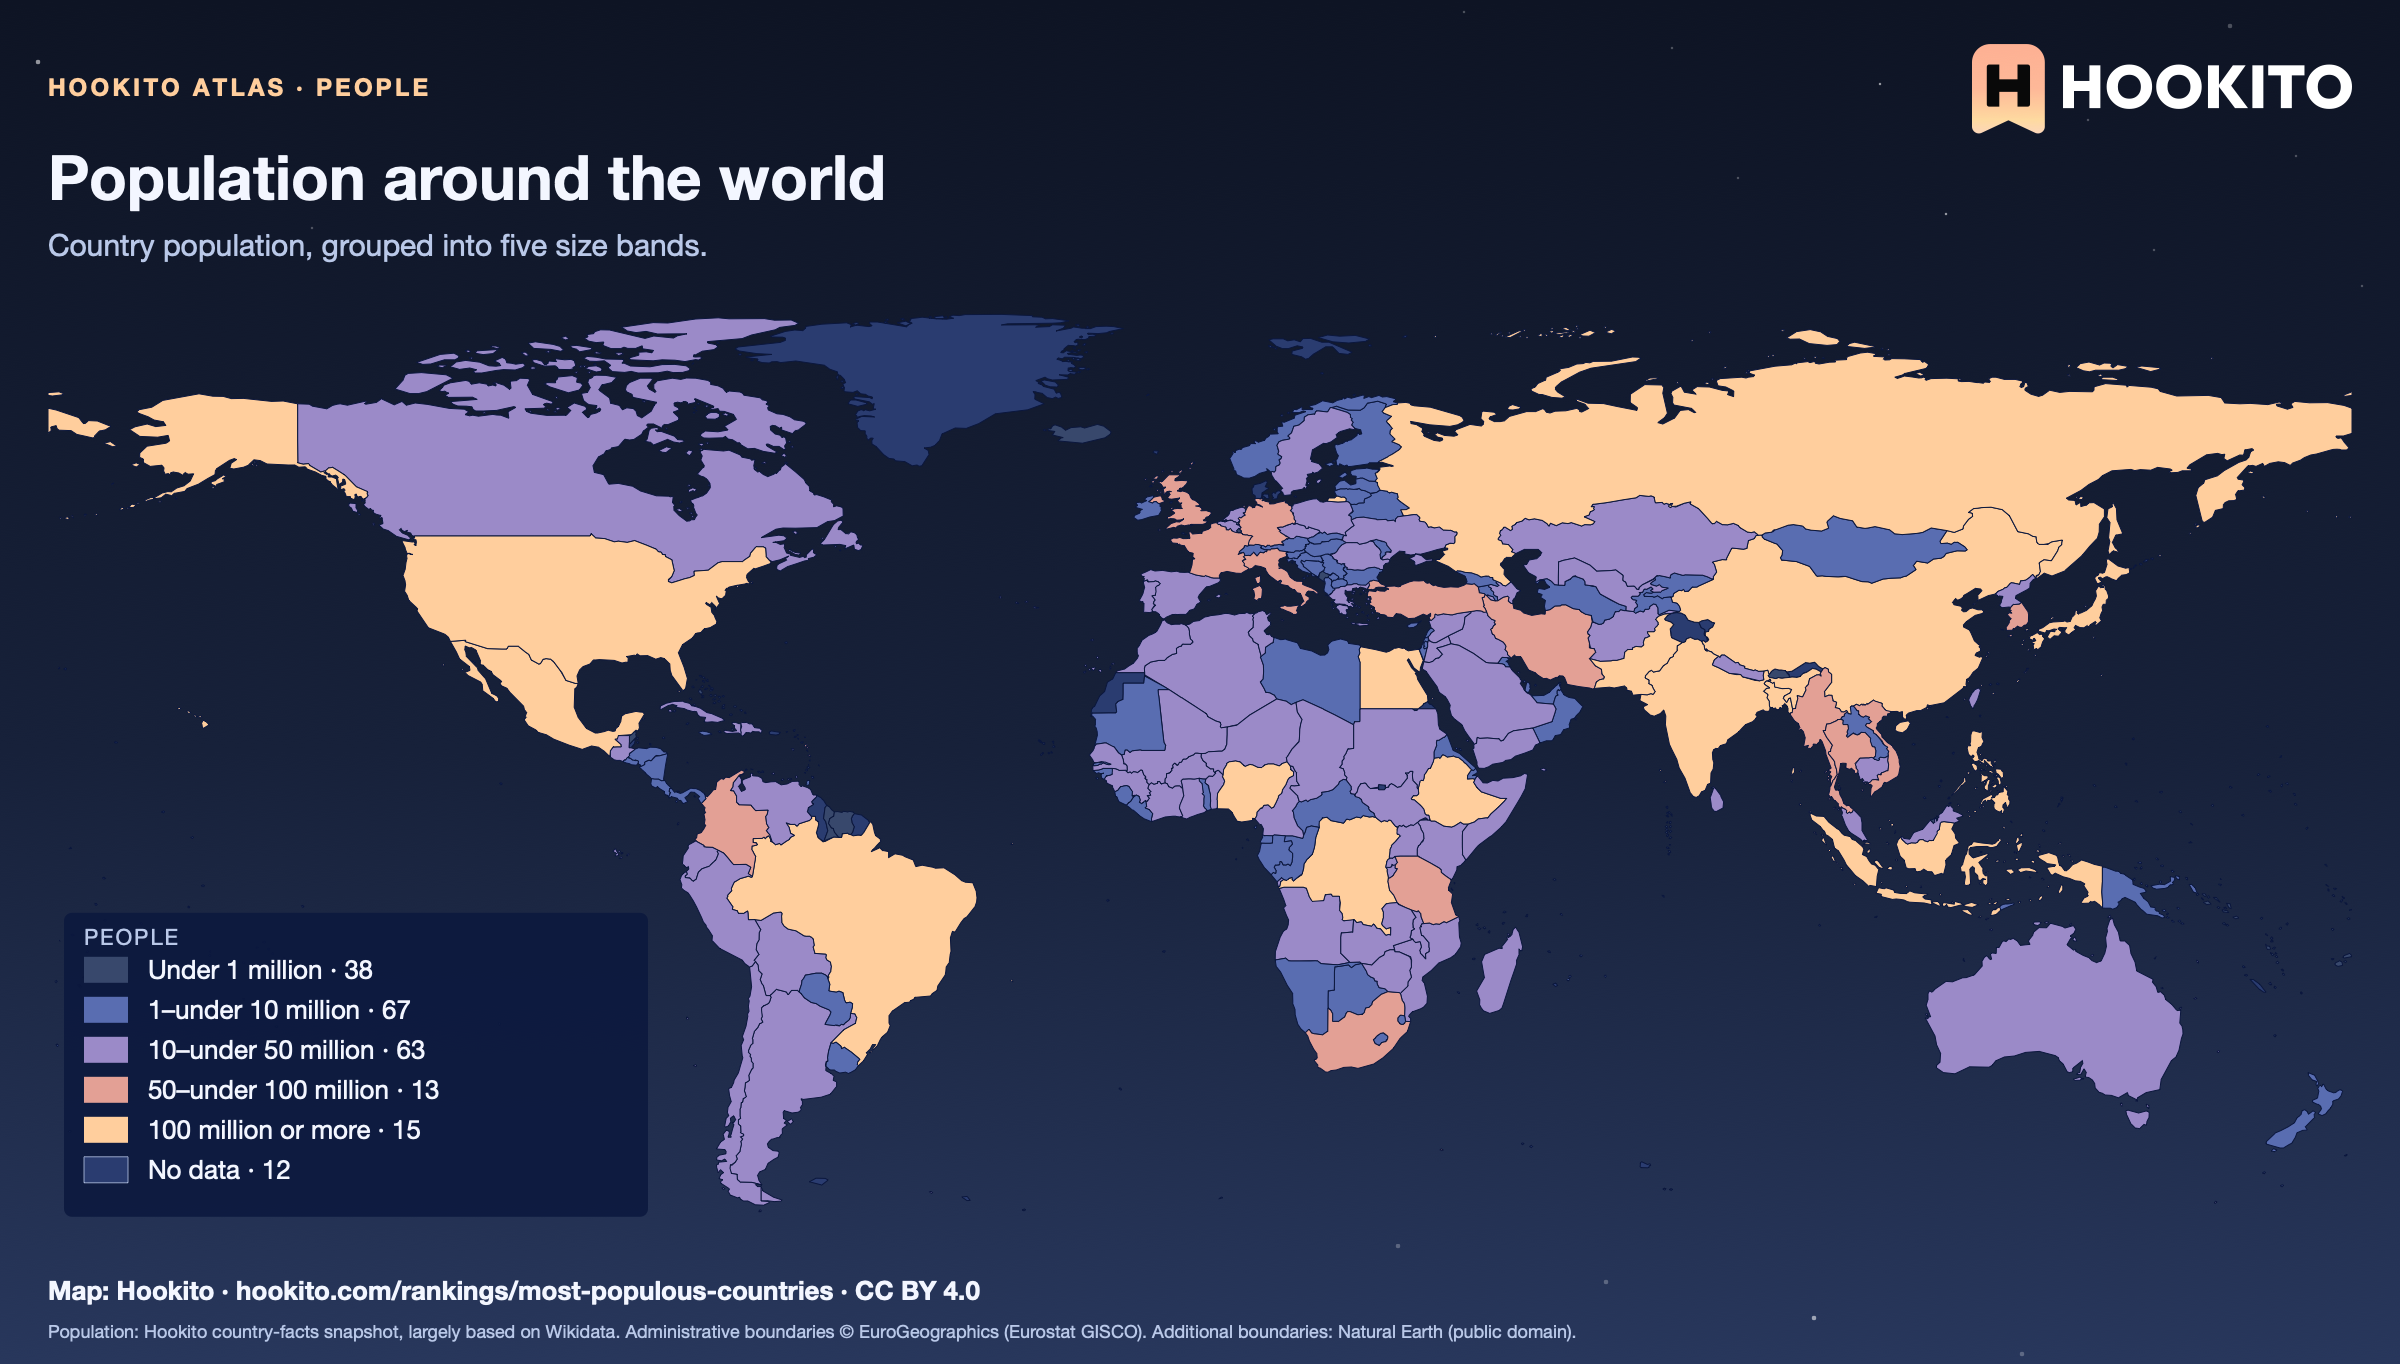
Population around the world

Population around the world: world map coloured by people, with 196 countries classified and 12 without data.

The colours show total population, not population density. A large country can have a small population, and a small country can have many residents.

Embed this map

Population: Hookito country-facts snapshot, largely based on Wikidata. Administrative boundaries © EuroGeographics (Eurostat GISCO). Additional boundaries: Natural Earth (public domain).
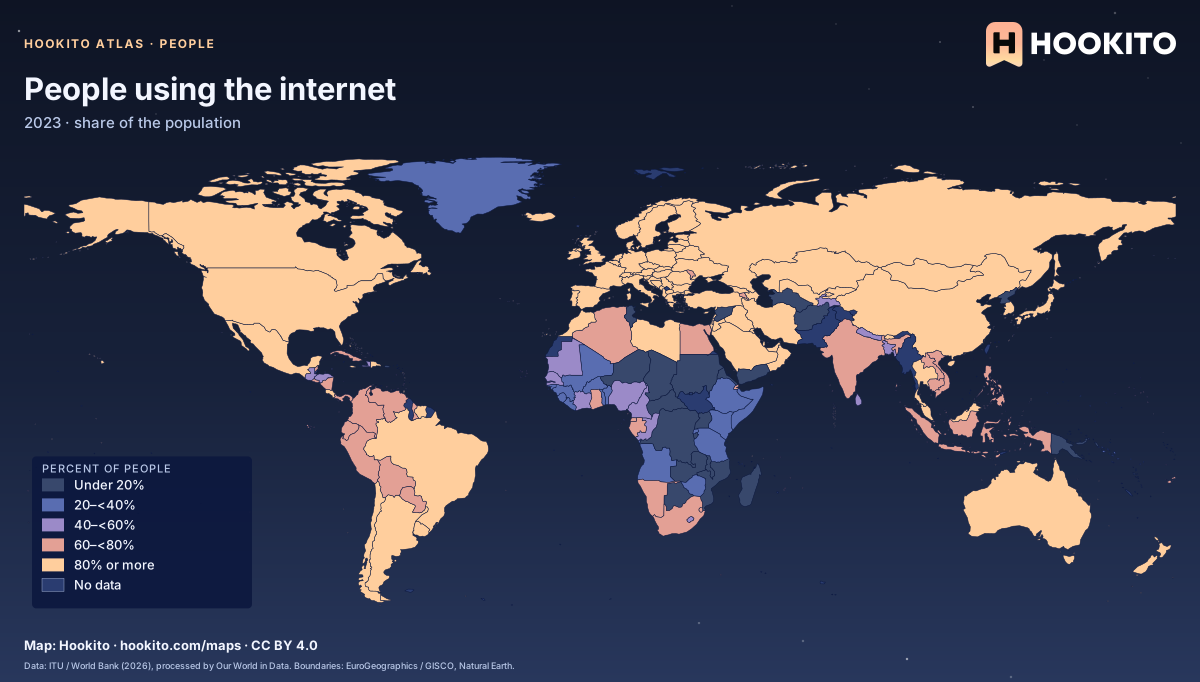
People using the internet

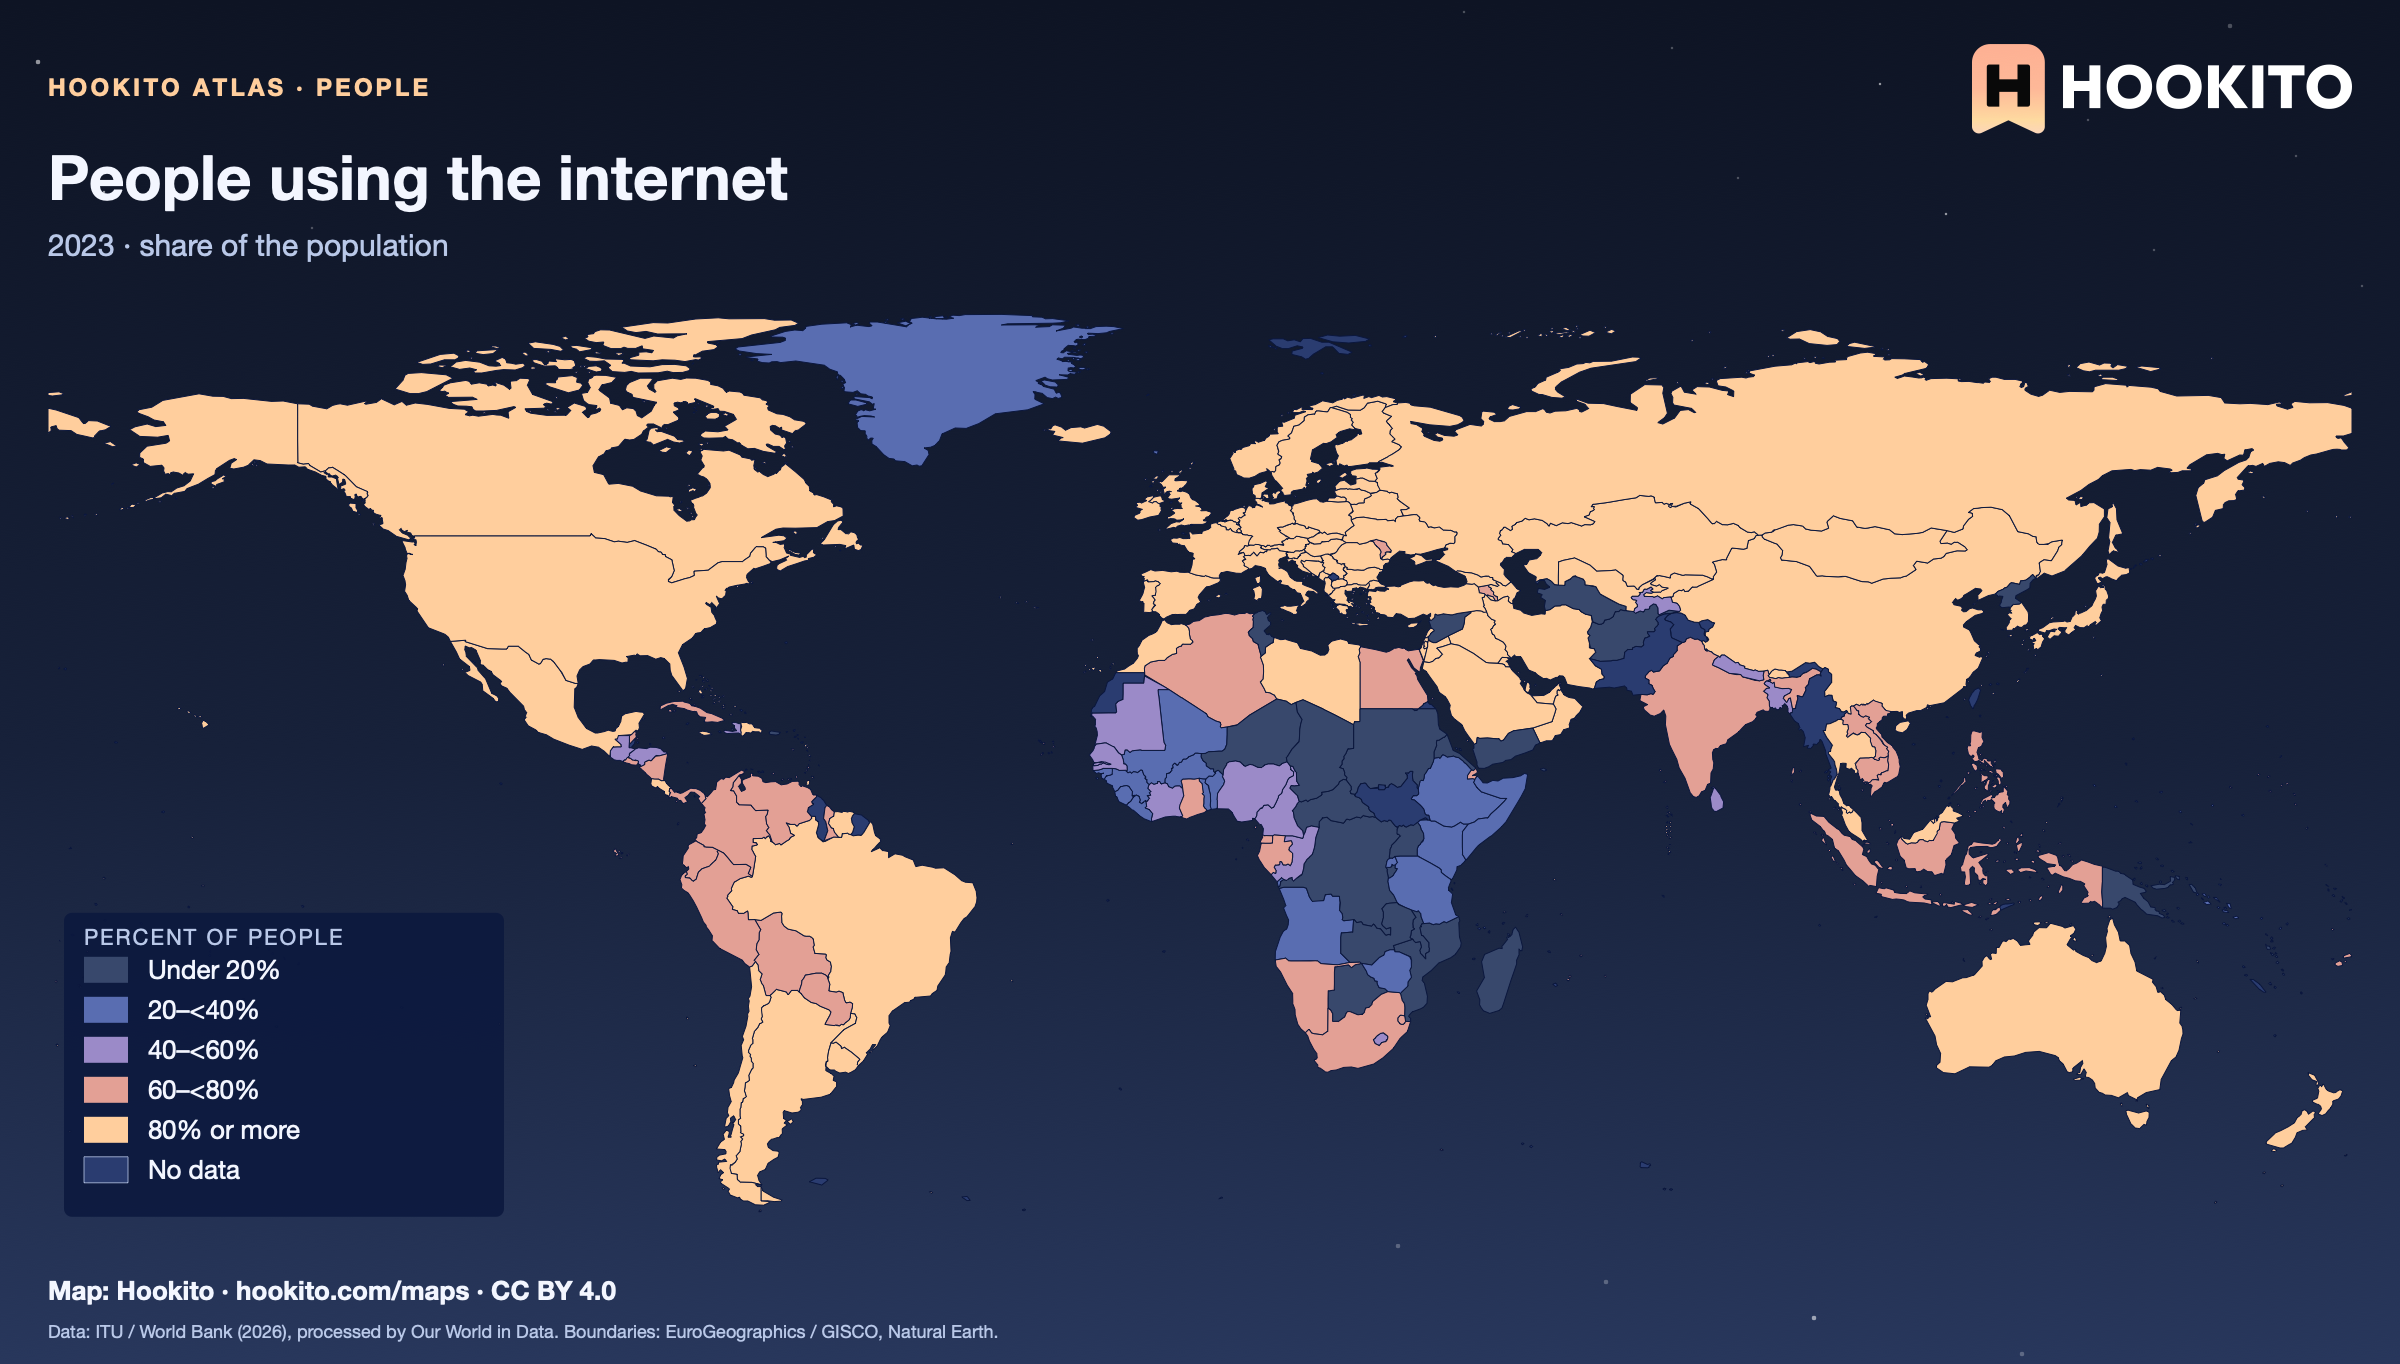
People using the internet, world map with five colour bands and missing data.

People who used the internet in the preceding three months. Grey-blue indicates no data. Source details and reuse terms: https://ourworldindata.org/grapher/share-of-individuals-using-the-internet.

Embed this map

Data: World Telecommunication/ICT Indicators Database - International Telecommunication Union (ITU), via World Bank (2026), via Our World in Data (https://ourworldindata.org/grapher/share-of-individuals-using-the-internet). Administrative boundaries © EuroGeographics (Eurostat GISCO). Additional boundaries: Natural Earth (public domain). Source data and citation ↗
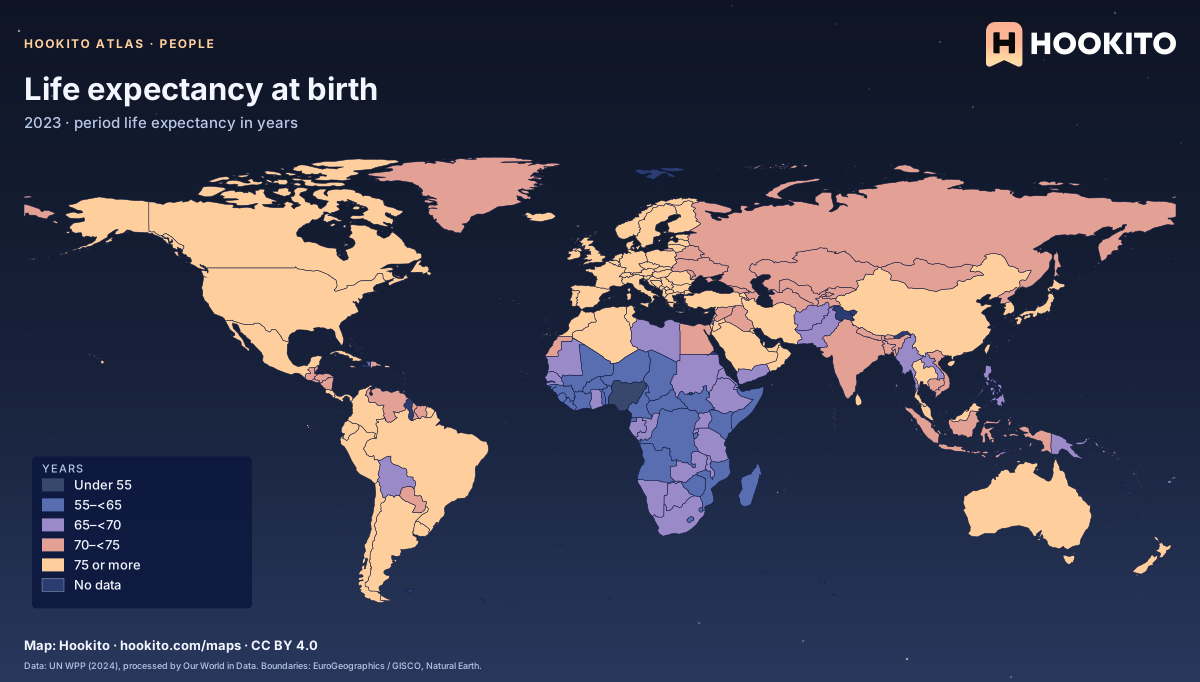
Life expectancy at birth

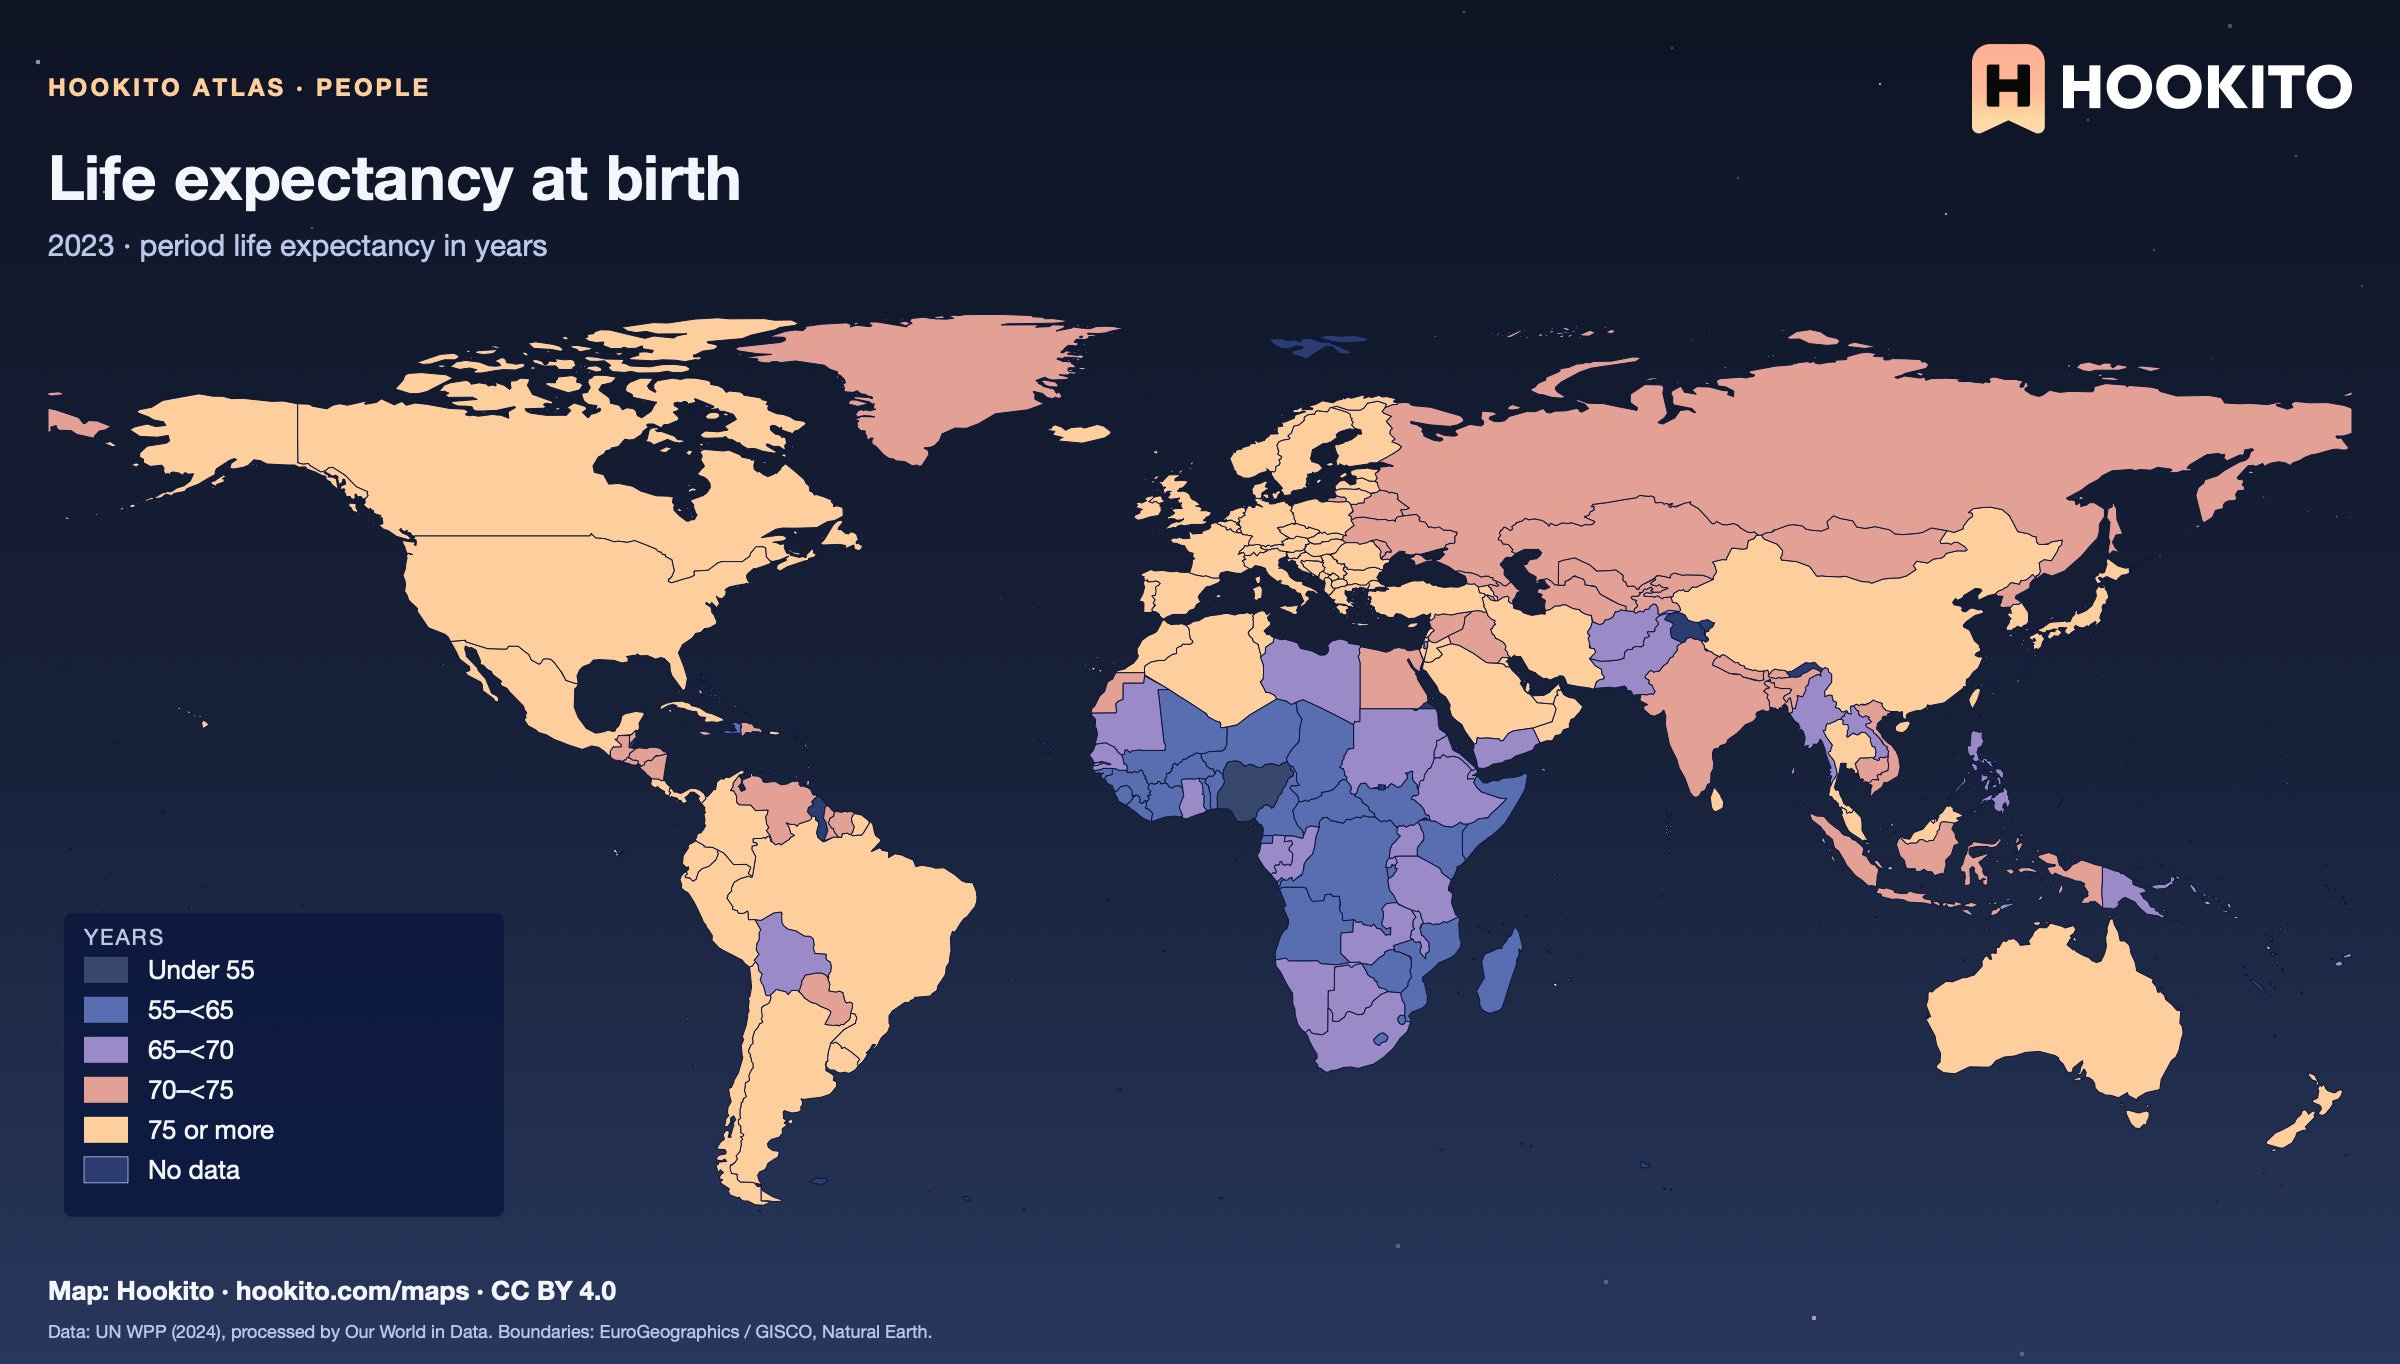
Life expectancy at birth, world map with five colour bands and missing data.

Period life expectancy assumes the age-specific death rates of the given year remain constant. Grey-blue indicates no data. Source details and reuse terms: https://ourworldindata.org/grapher/life-expectancy.

Embed this map

Data: Riley (2005); Zijdeman et al. (2015); HMD (2025); UN WPP (2024), via Our World in Data (https://ourworldindata.org/grapher/life-expectancy). Administrative boundaries © EuroGeographics (Eurostat GISCO). Additional boundaries: Natural Earth (public domain). Source data and citation ↗
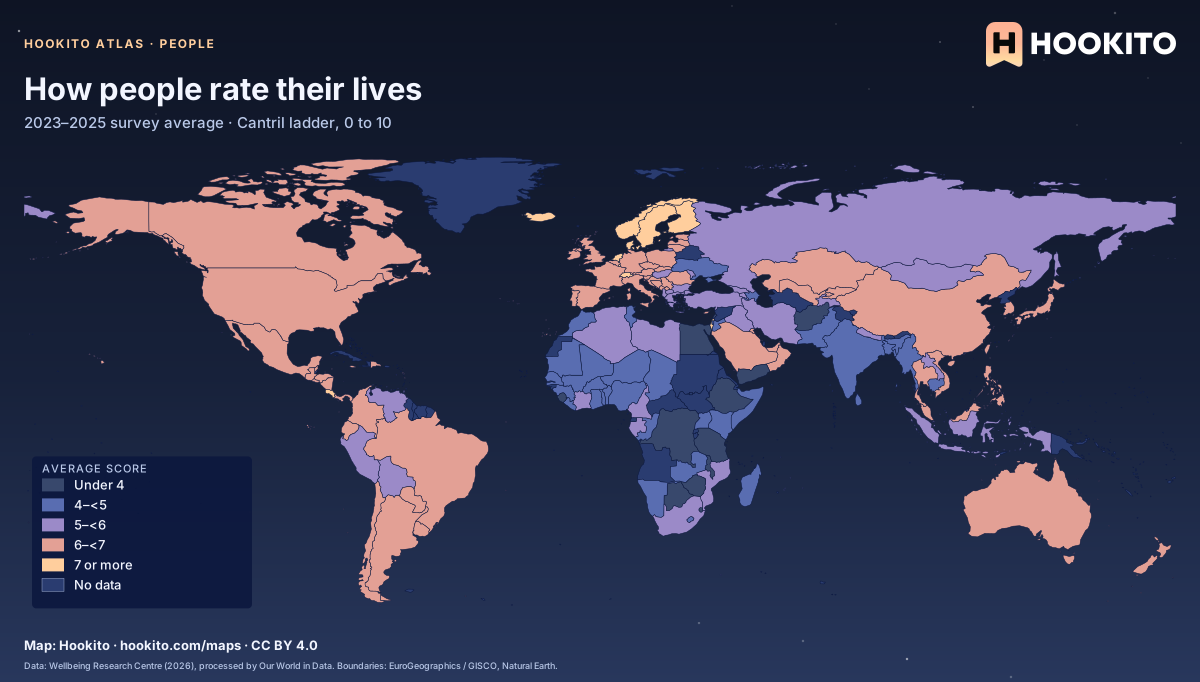
How people rate their lives

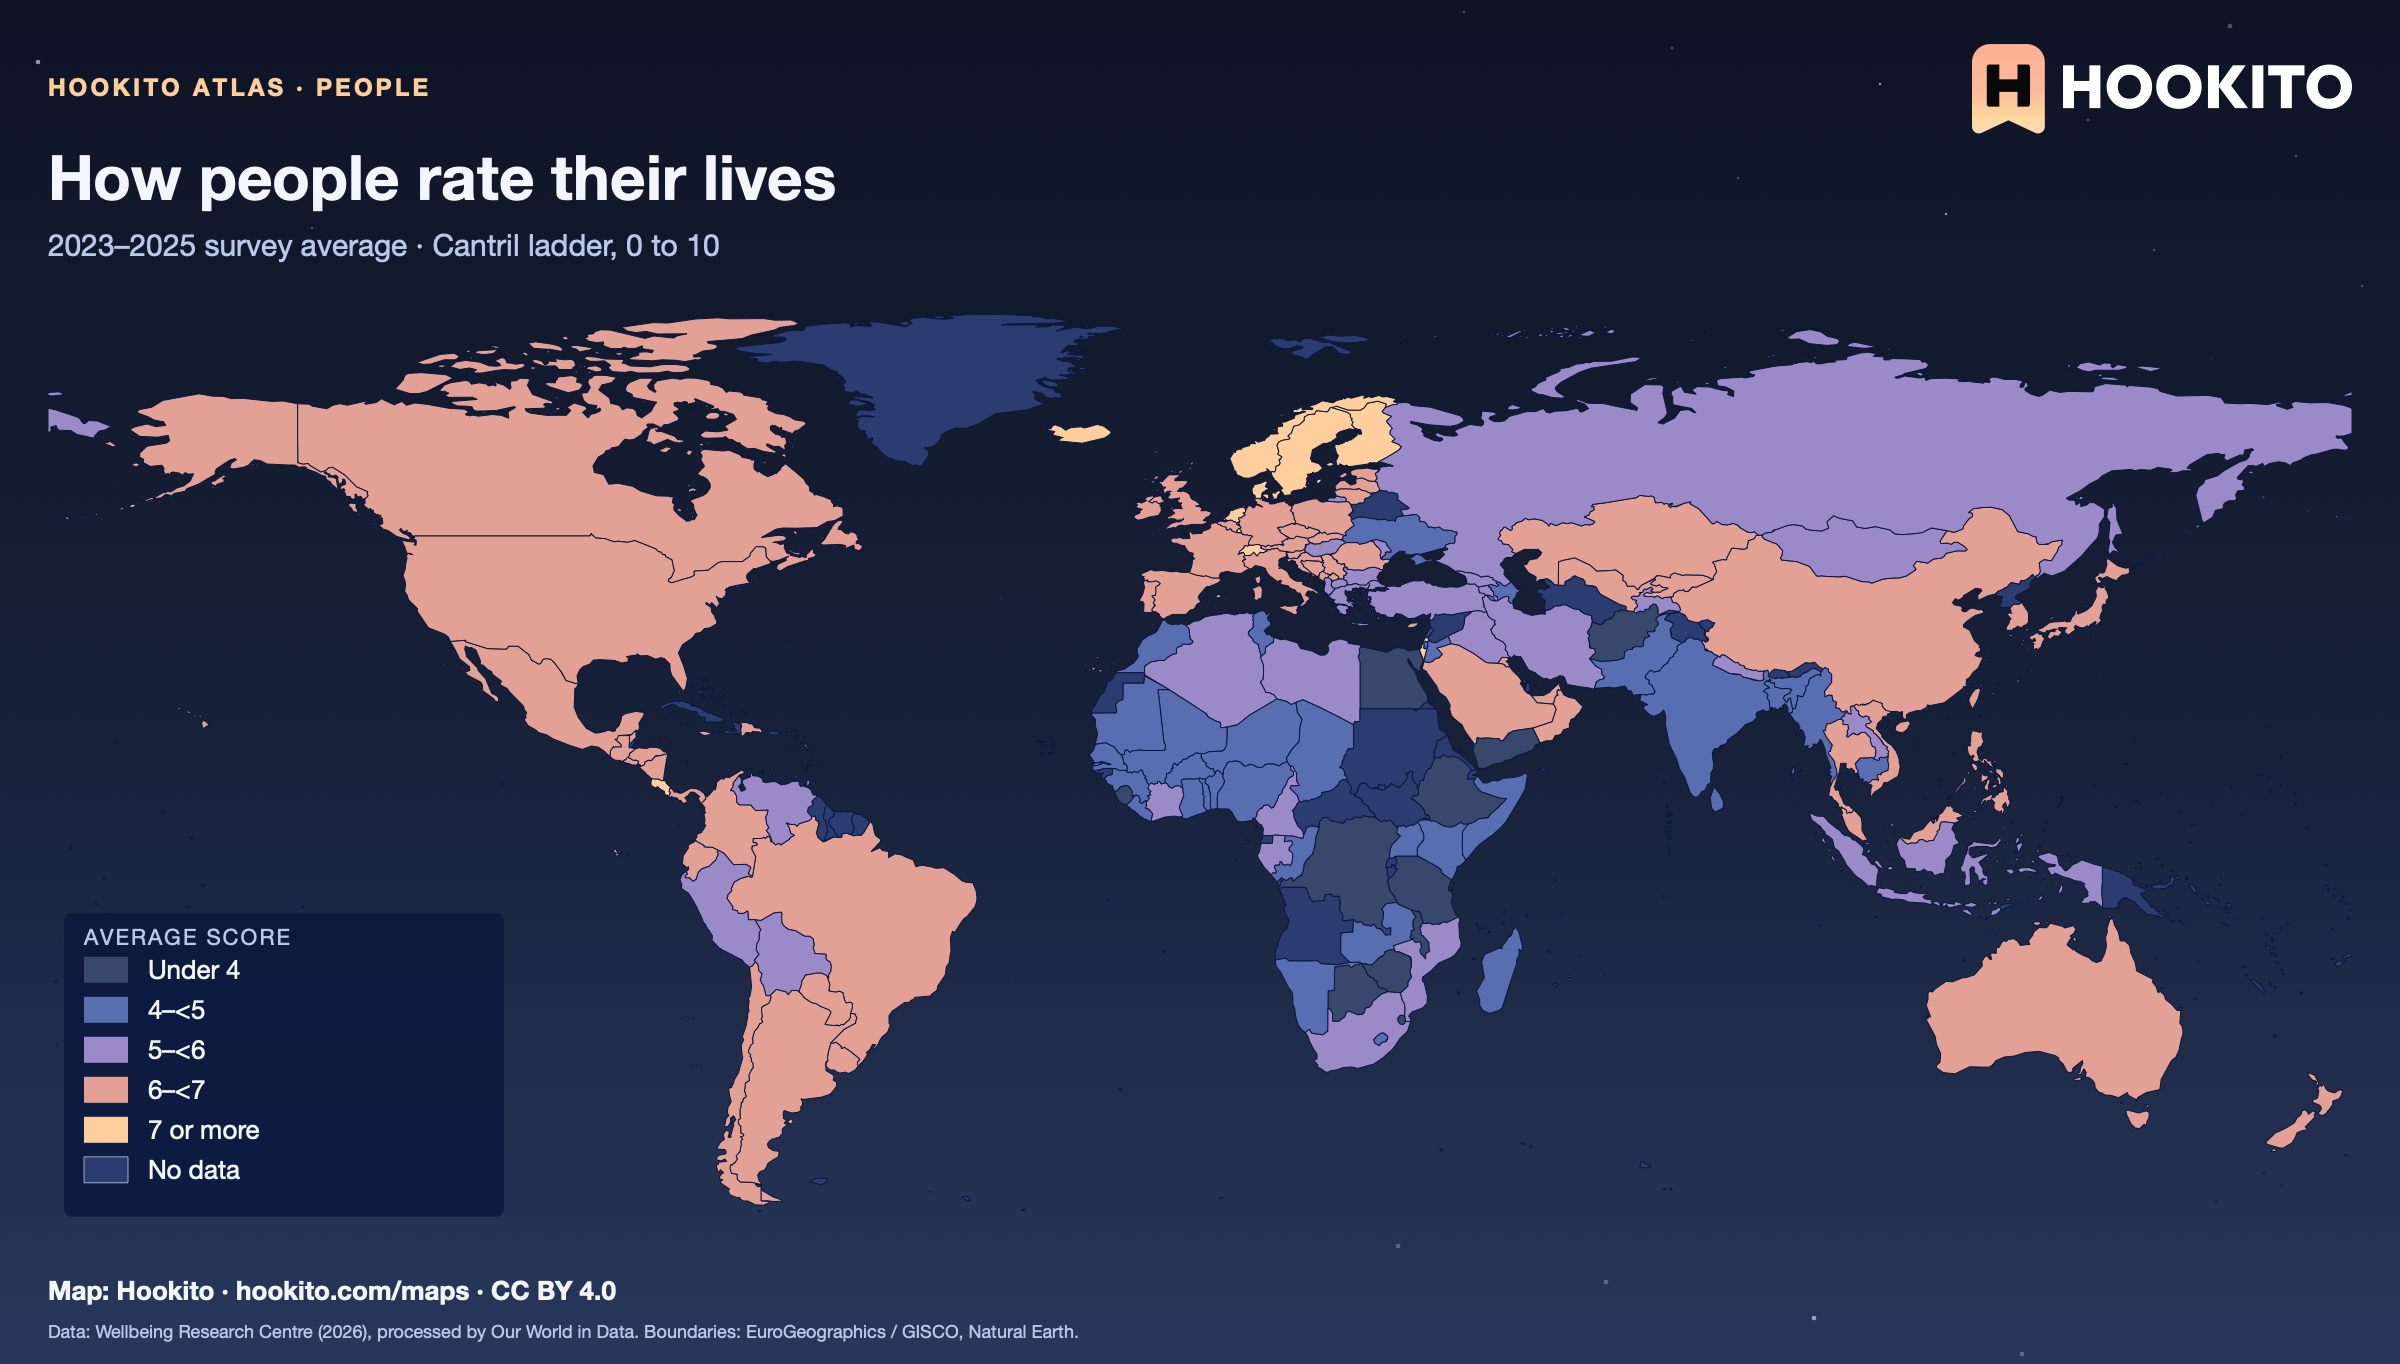
How people rate their lives, world map with five colour bands and missing data.

National averages of self-reported life satisfaction on a 0–10 ladder, from surveys in 2023–2025. Grey-blue indicates no data. Source details and reuse terms: https://ourworldindata.org/grapher/happiness-cantril-ladder.

Embed this map

Data: Wellbeing Research Centre (2026), via Our World in Data (https://ourworldindata.org/grapher/happiness-cantril-ladder). Administrative boundaries © EuroGeographics (Eurostat GISCO). Additional boundaries: Natural Earth (public domain). Source data and citation ↗
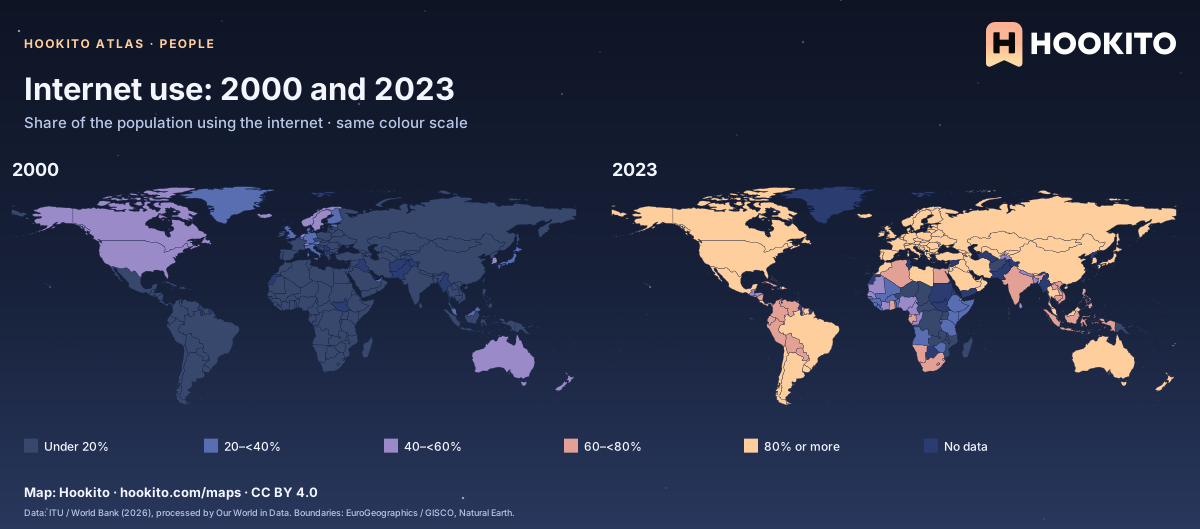
Internet use: 2000 and 2023

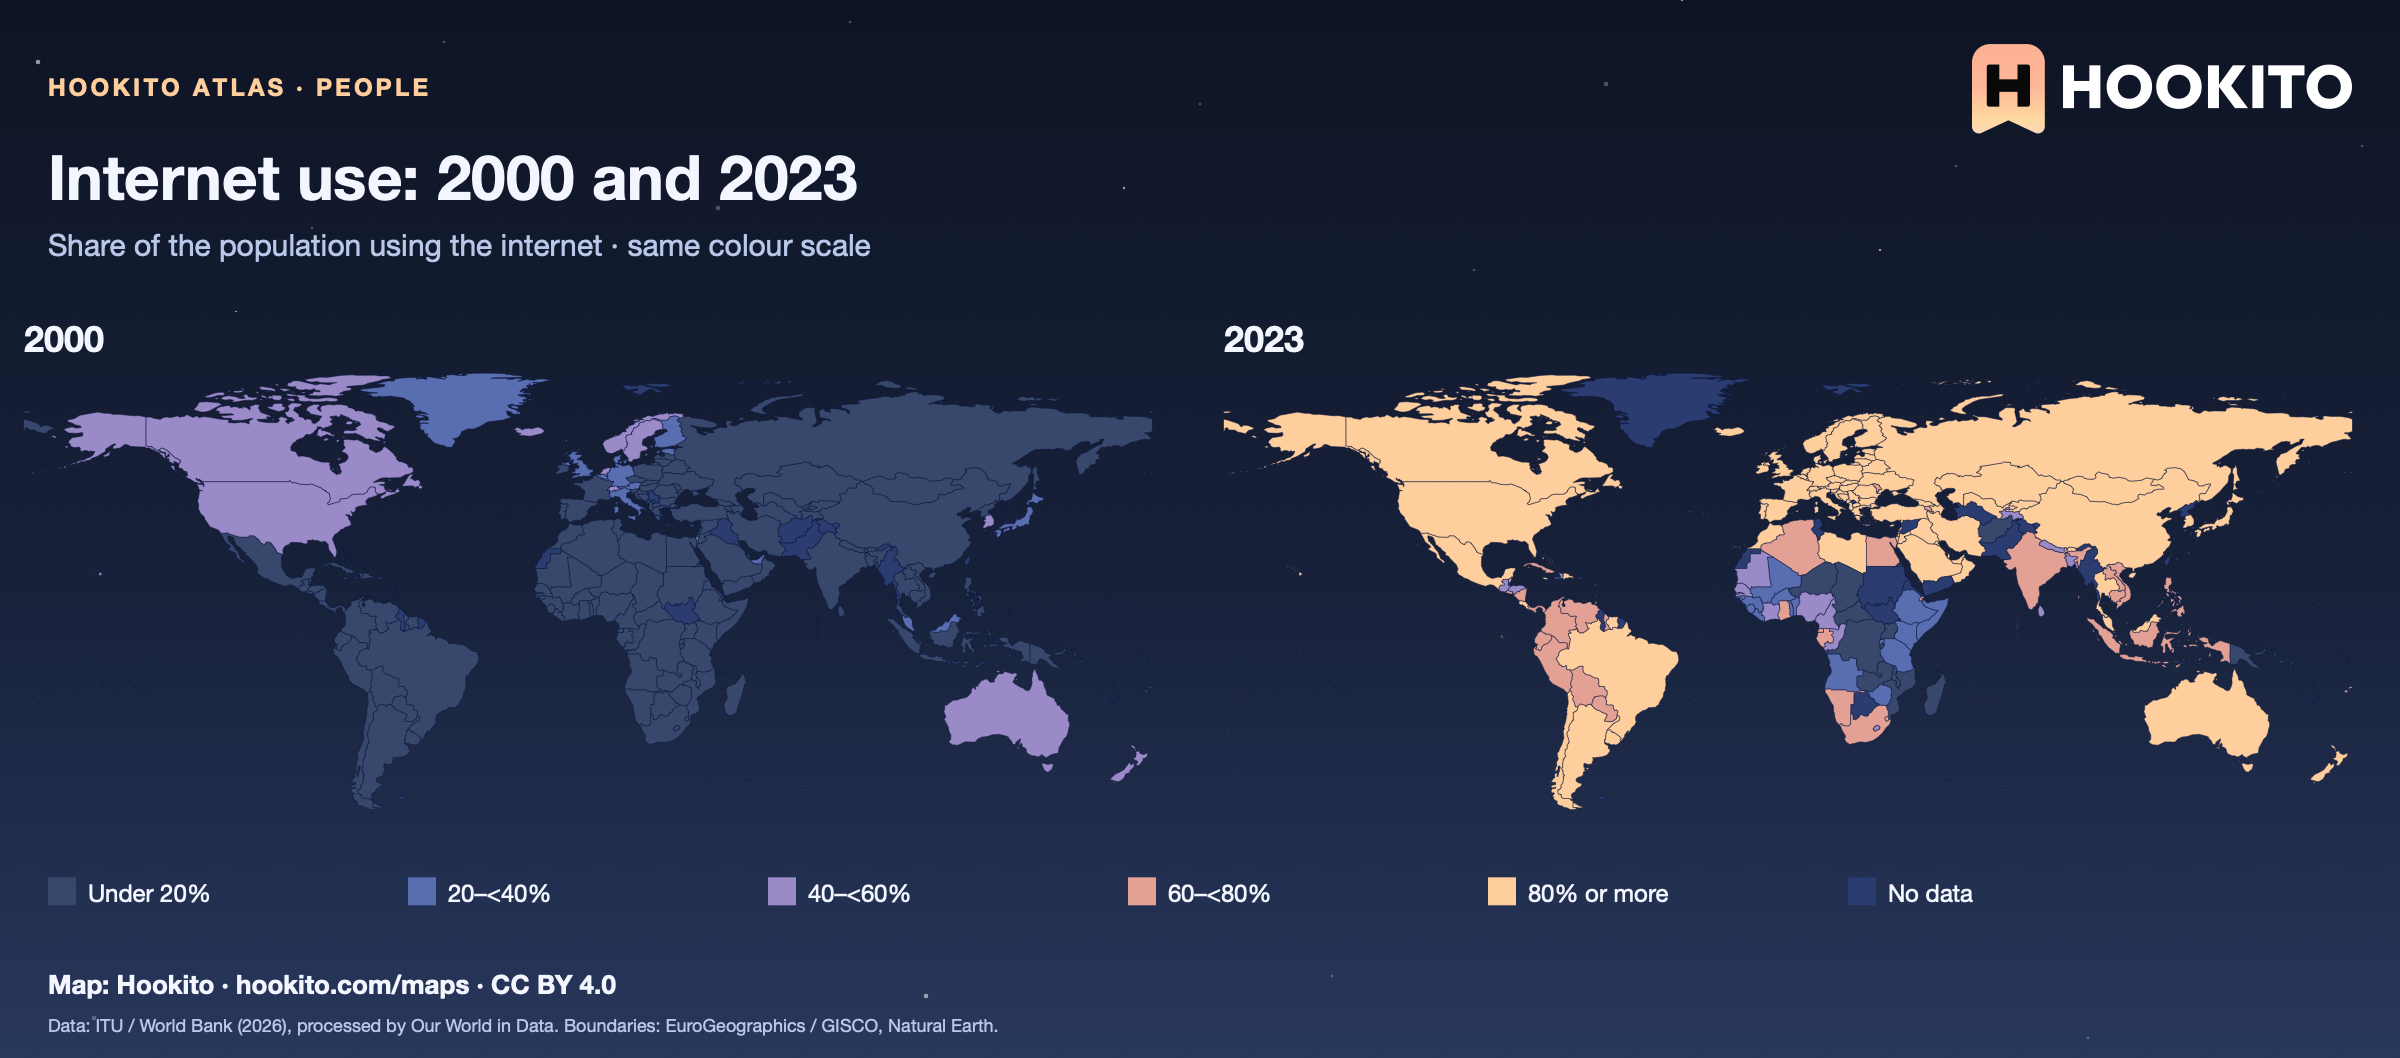
Two world maps compare the percentage of internet users in 2000 and 2023 on the same scale.

People who used the internet in the preceding three months. Each panel uses only observations for that year; grey-blue indicates no data. Source details and reuse terms: https://ourworldindata.org/grapher/share-of-individuals-using-the-internet.

Embed this map

Data: World Telecommunication/ICT Indicators Database - International Telecommunication Union (ITU), via World Bank (2026), via Our World in Data (https://ourworldindata.org/grapher/share-of-individuals-using-the-internet). Administrative boundaries © EuroGeographics (Eurostat GISCO). Additional boundaries: Natural Earth (public domain). Source data and citation ↗
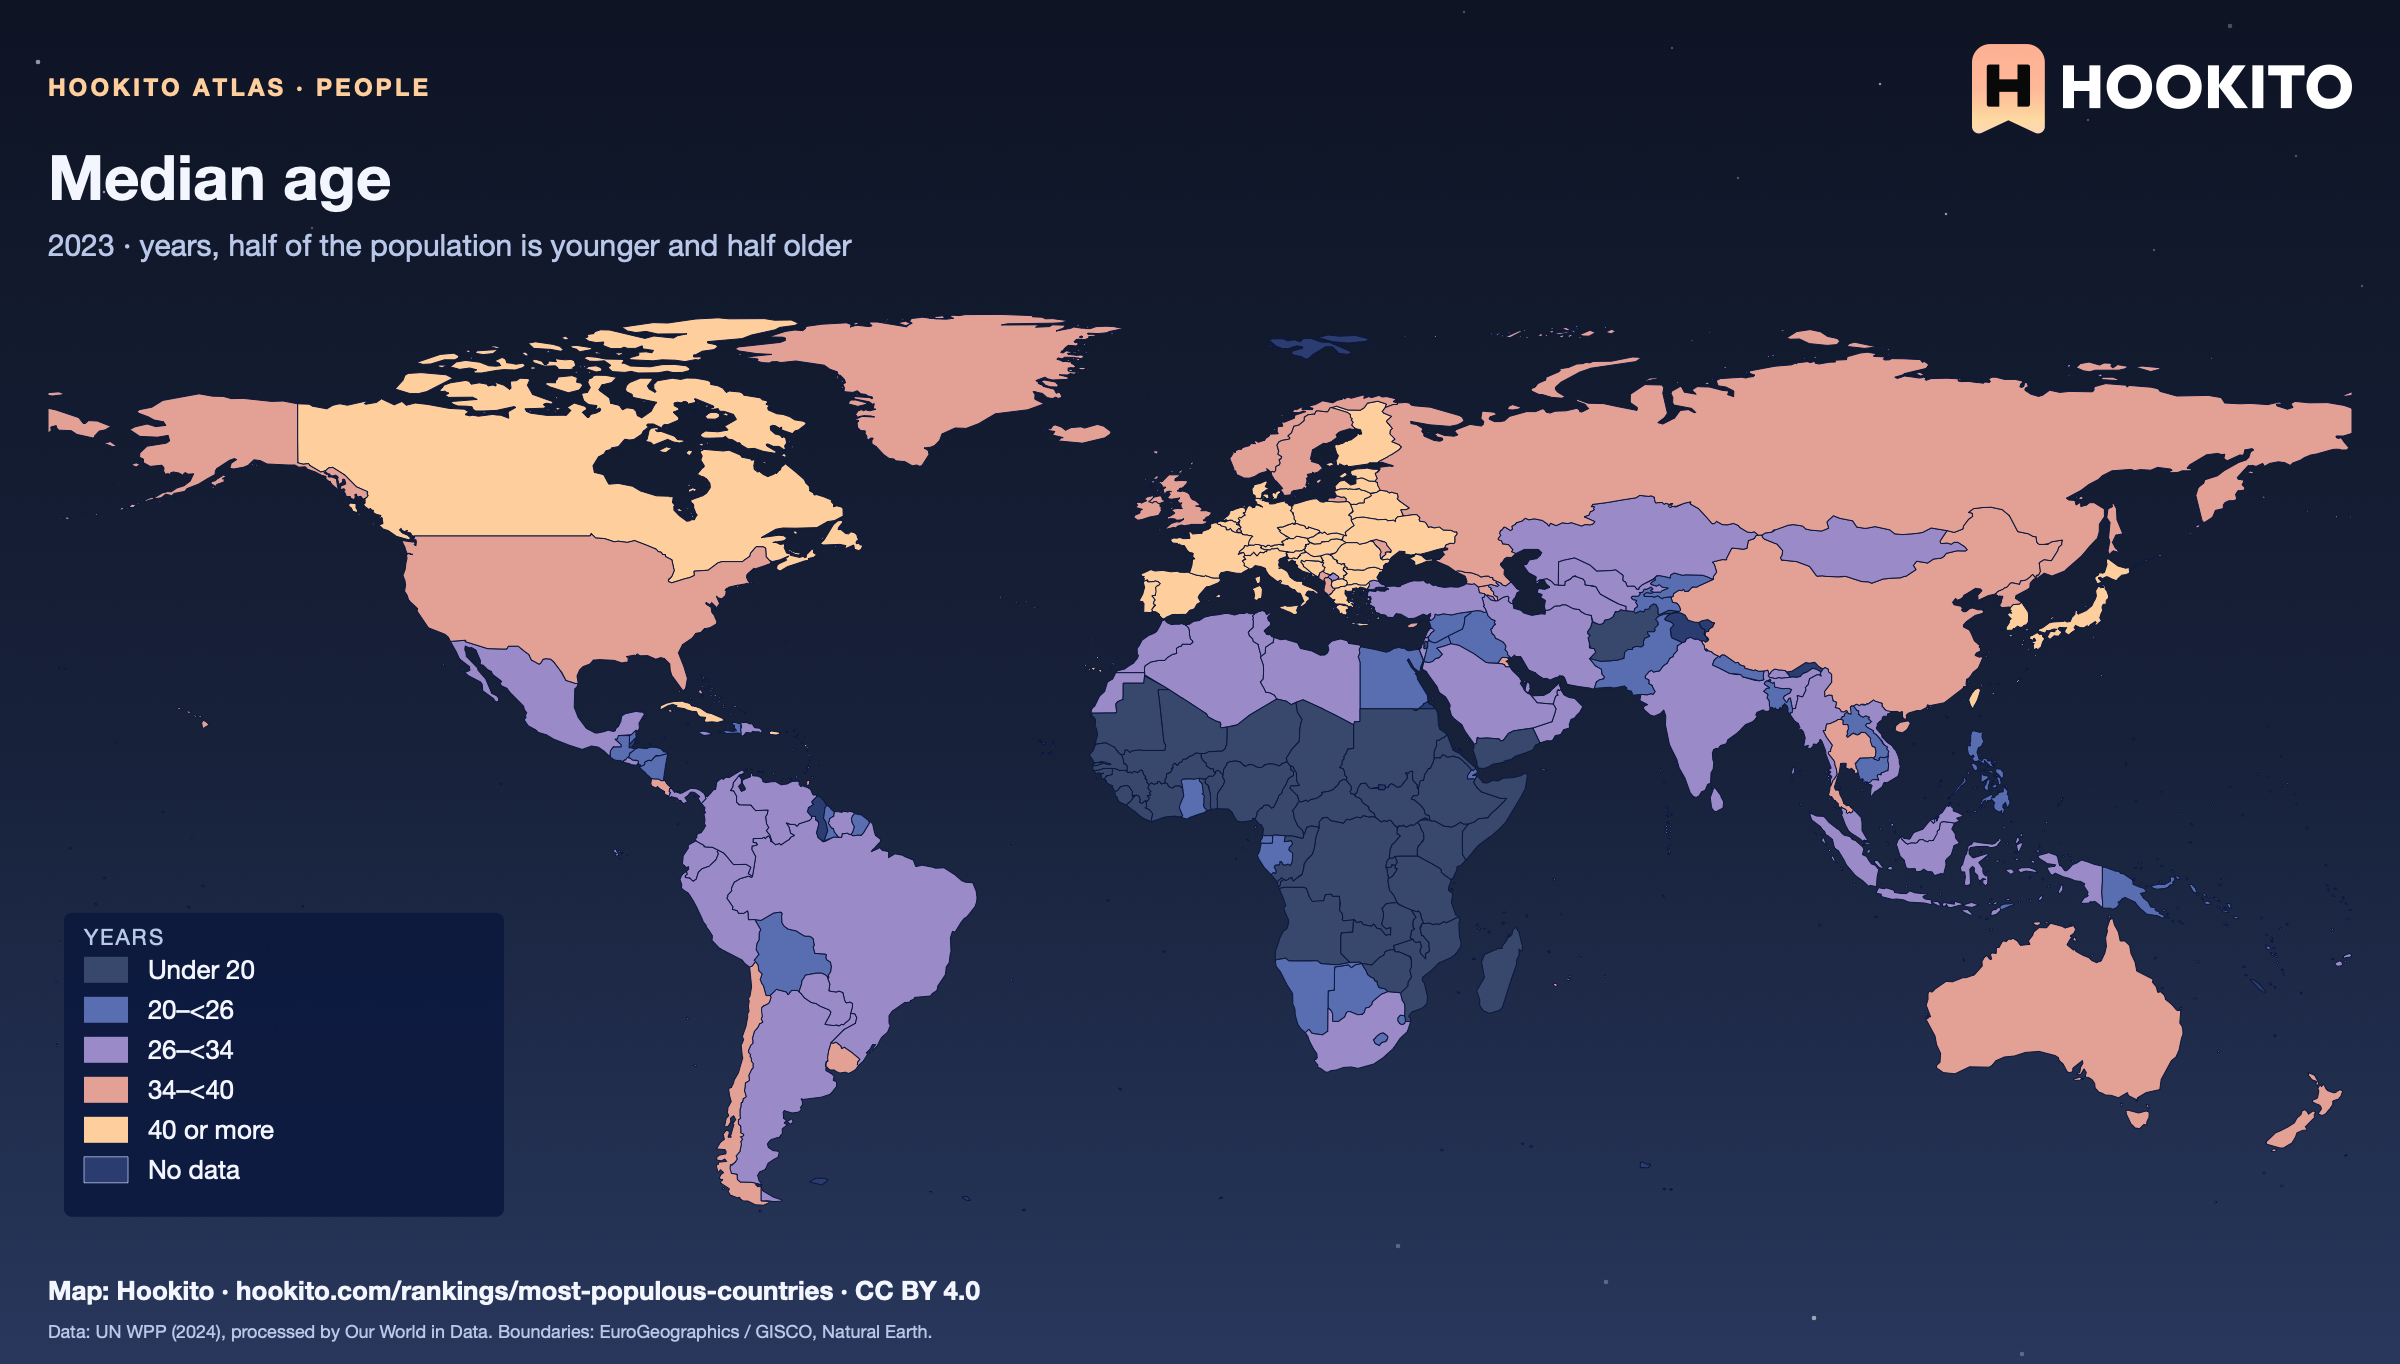
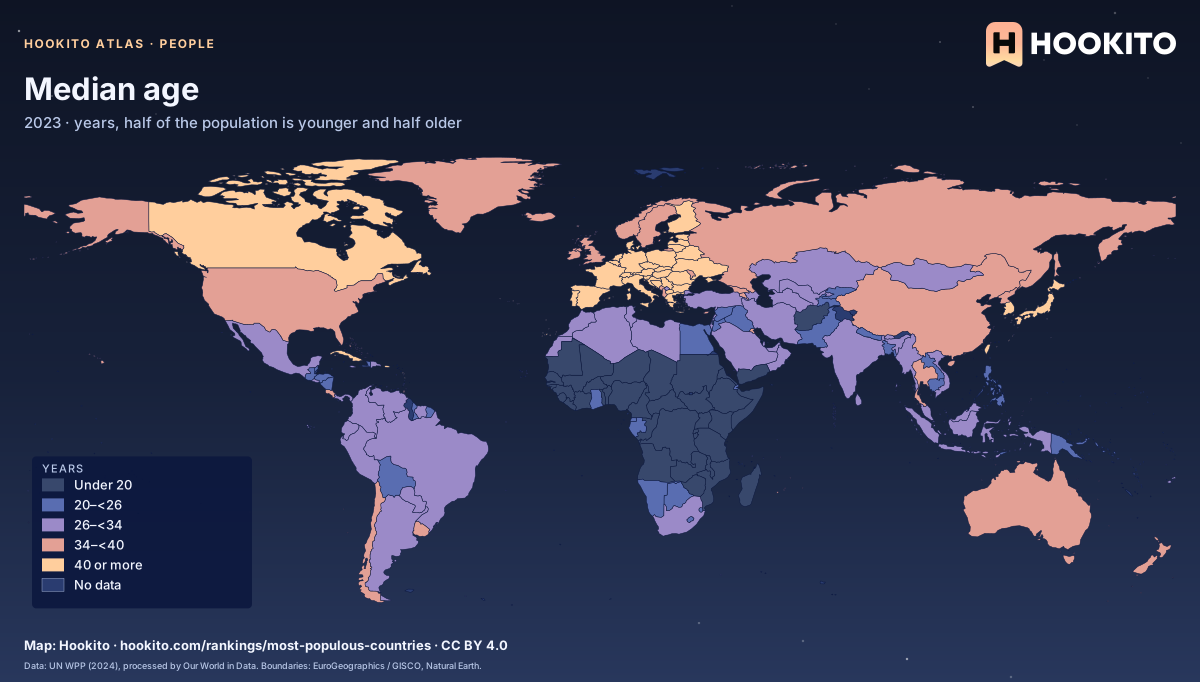
Median age

Median age, world map with five colour bands and missing data.

The age that divides a country’s population into two equal halves. UN estimates for 2023, the last year in the series before projections. Grey-blue indicates no data. Source details and reuse terms: https://ourworldindata.org/grapher/median-age.

Embed this map

Data: UN, World Population Prospects (2024), via Our World in Data (https://ourworldindata.org/grapher/median-age). Administrative boundaries © EuroGeographics (Eurostat GISCO). Additional boundaries: Natural Earth (public domain). Source data and citation ↗
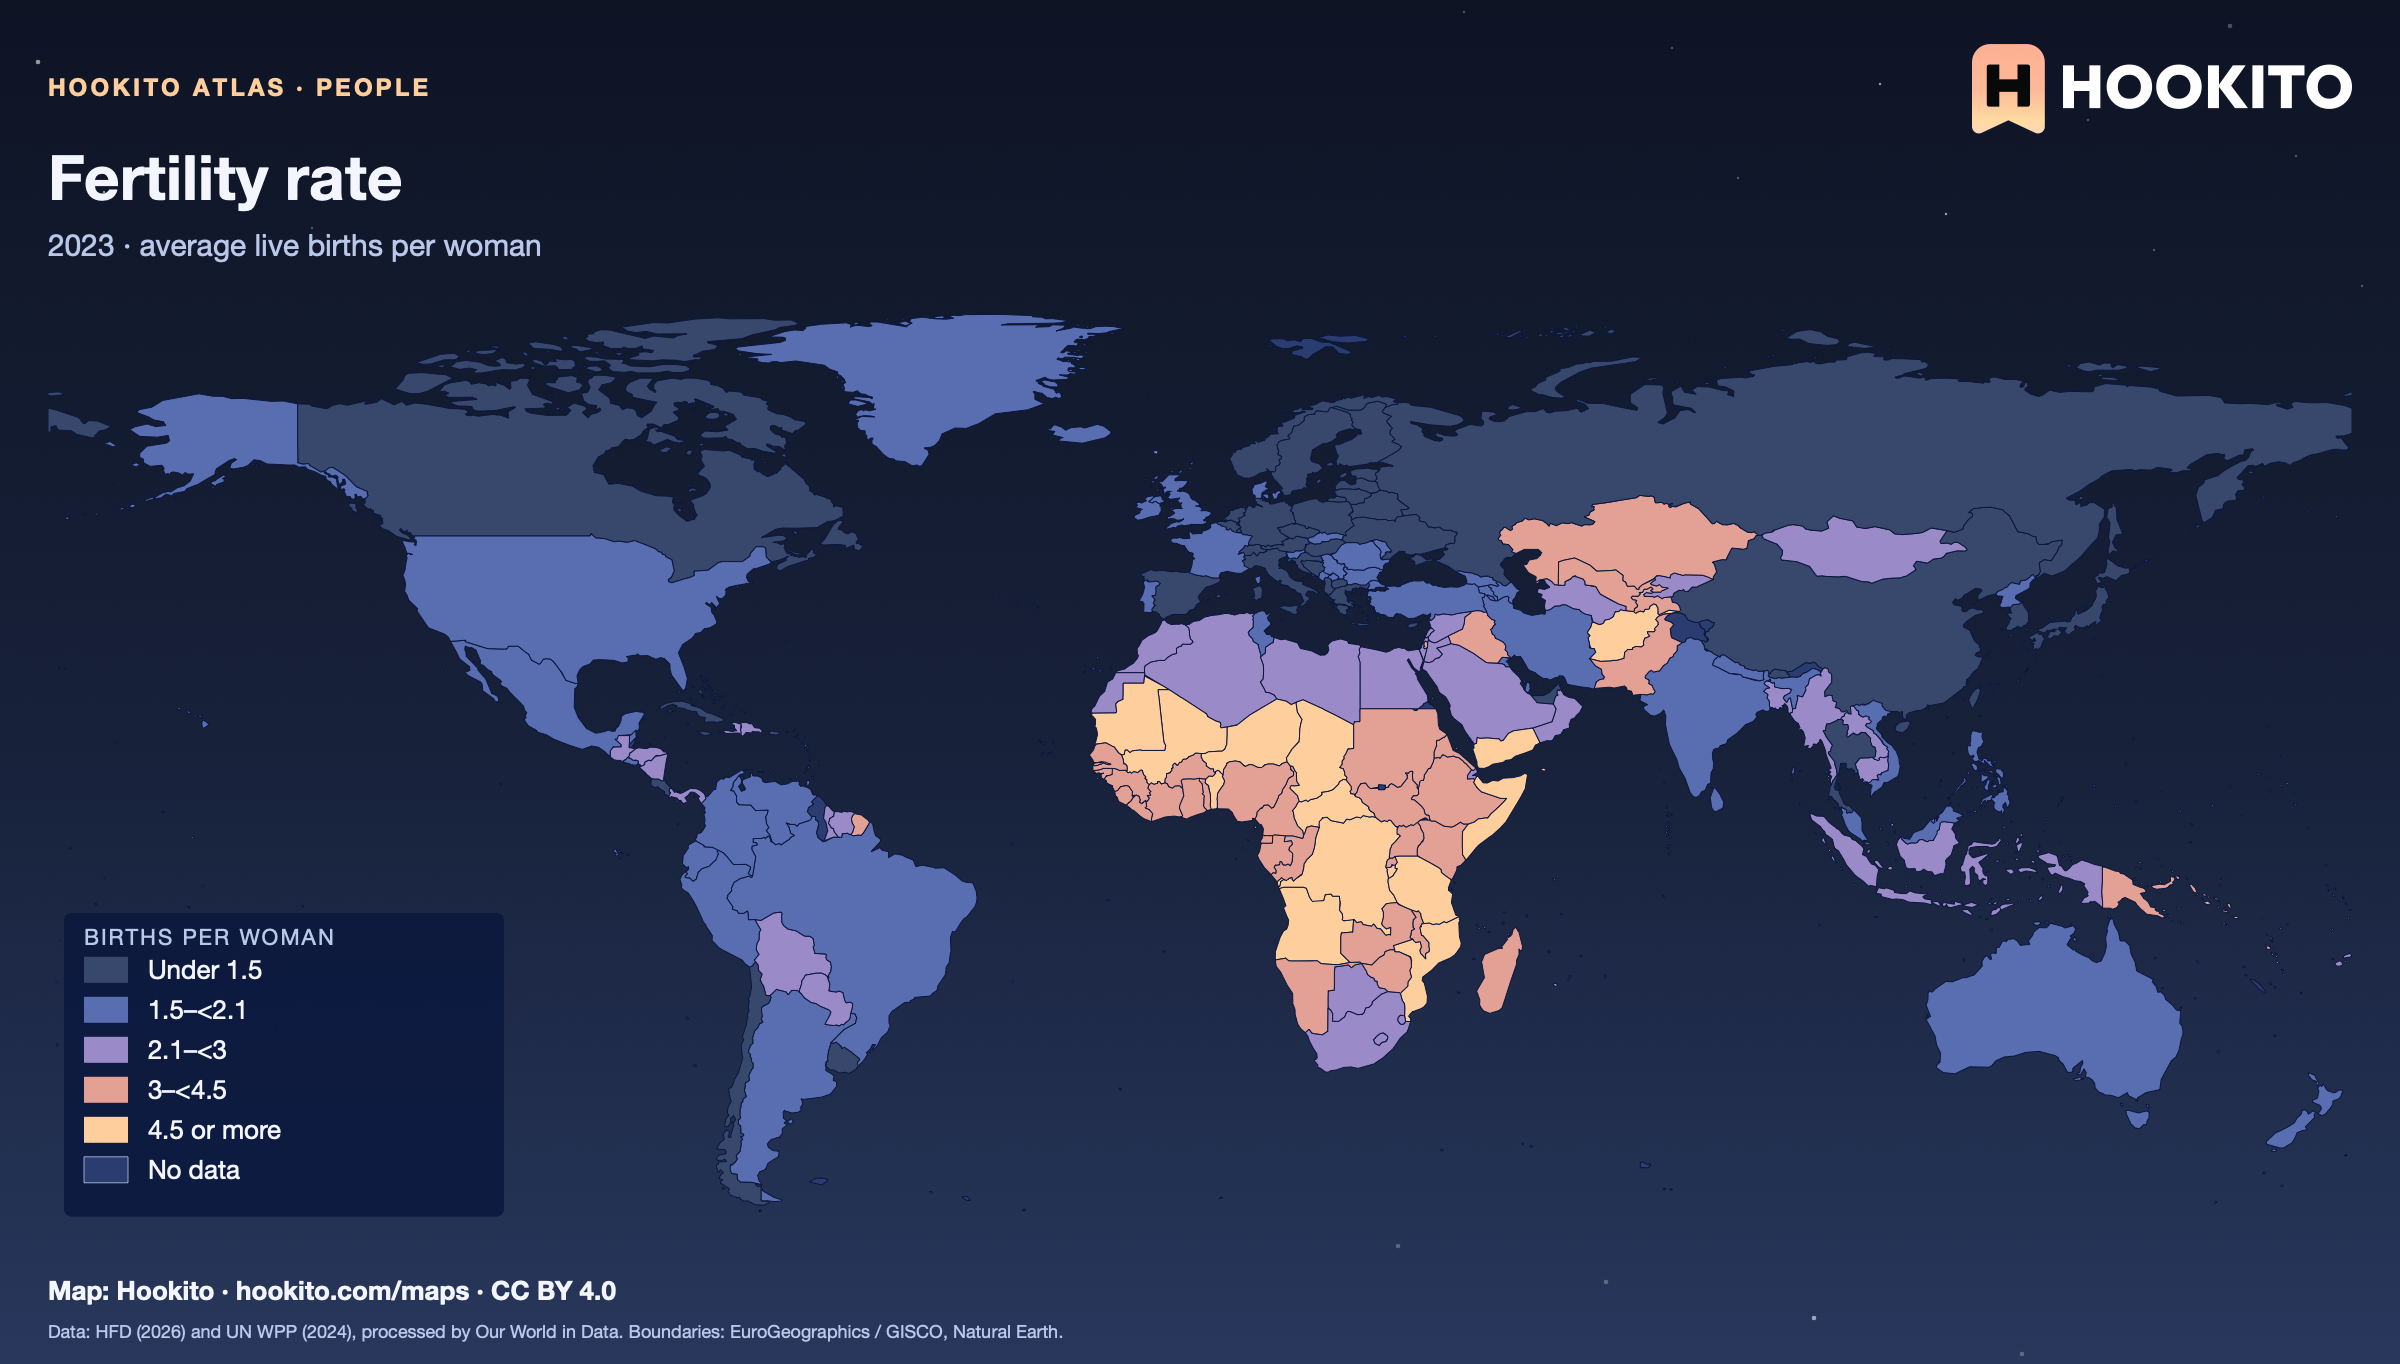
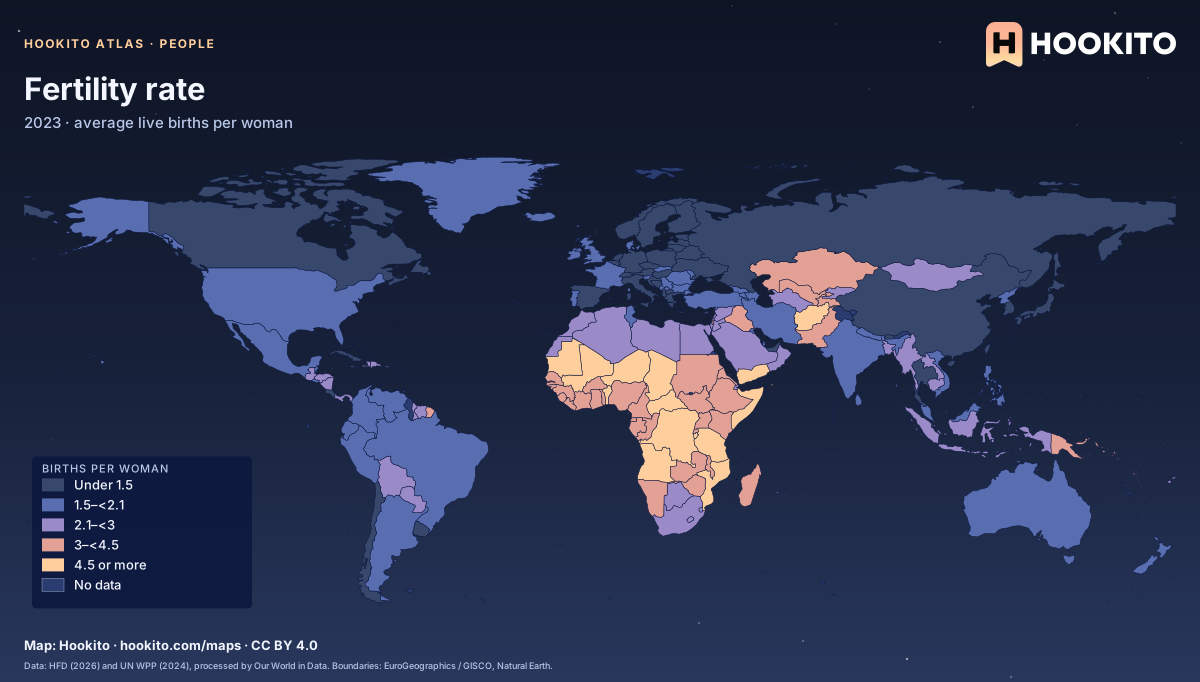
Fertility rate

Fertility rate, world map with five colour bands and missing data.

The number of children a woman would have if she experienced the birth rates of each age group seen in 2023 across her childbearing years. About 2.1 is the level at which a population roughly replaces itself without migration. Grey-blue indicates no data. Source details and reuse terms: https://ourworldindata.org/grapher/children-born-per-woman.

Embed this map

Data: Human Fertility Database (2026); UN, World Population Prospects (2024), via Our World in Data (https://ourworldindata.org/grapher/children-born-per-woman). Administrative boundaries © EuroGeographics (Eurostat GISCO). Additional boundaries: Natural Earth (public domain). Source data and citation ↗
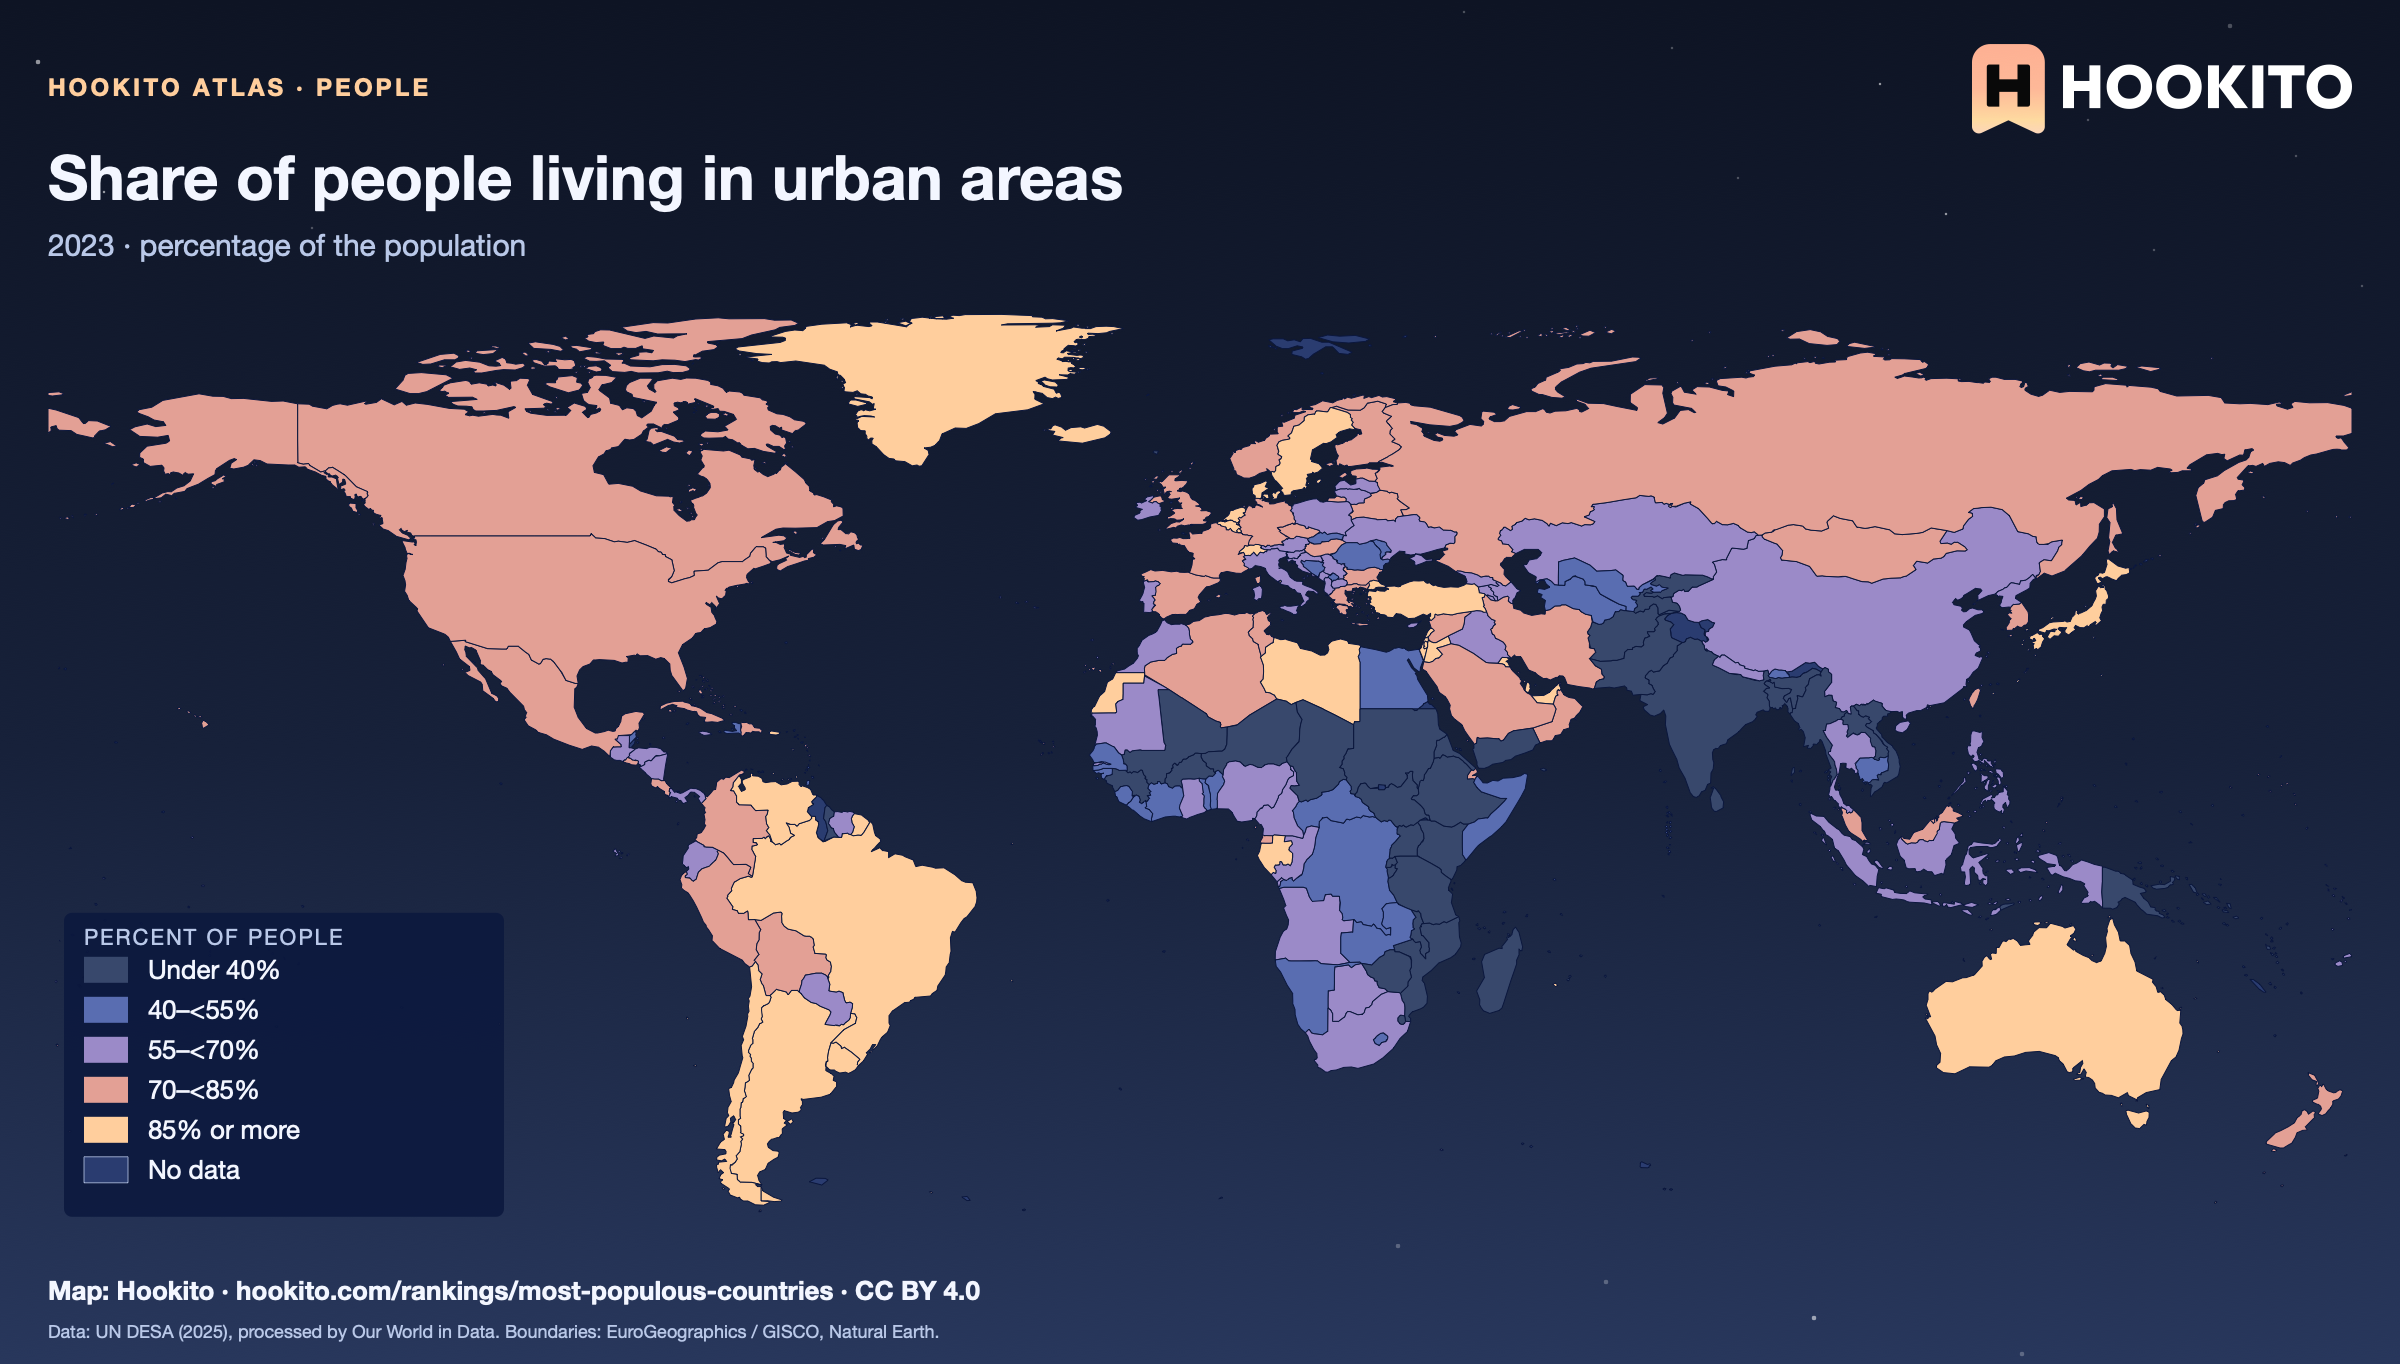
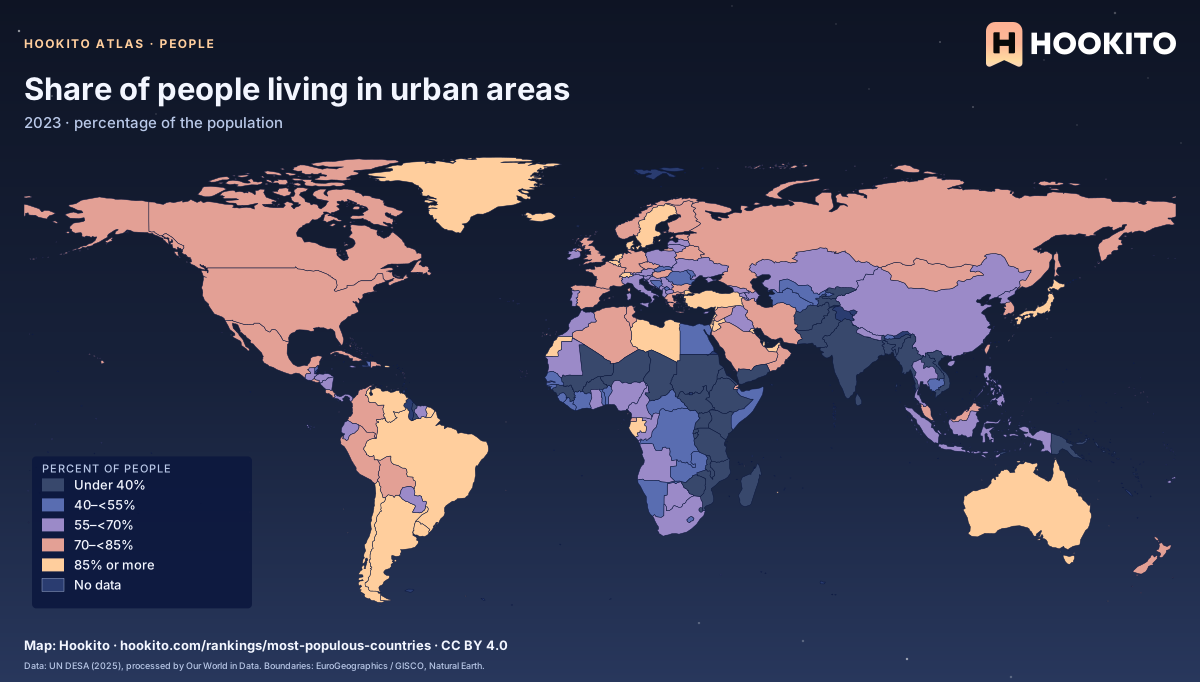
Share of people living in urban areas

Share of people living in urban areas, world map with five colour bands and missing data.

Urban areas follow each country’s own national definition, so the threshold for a town differs between countries. UN estimates for 2023. Grey-blue indicates no data. Source details and reuse terms: https://ourworldindata.org/grapher/share-of-population-urban.

Embed this map

Data: United Nations Department of Economic and Social Affairs, Population Division (2025), via Our World in Data (https://ourworldindata.org/grapher/share-of-population-urban). Administrative boundaries © EuroGeographics (Eurostat GISCO). Additional boundaries: Natural Earth (public domain). Source data and citation ↗
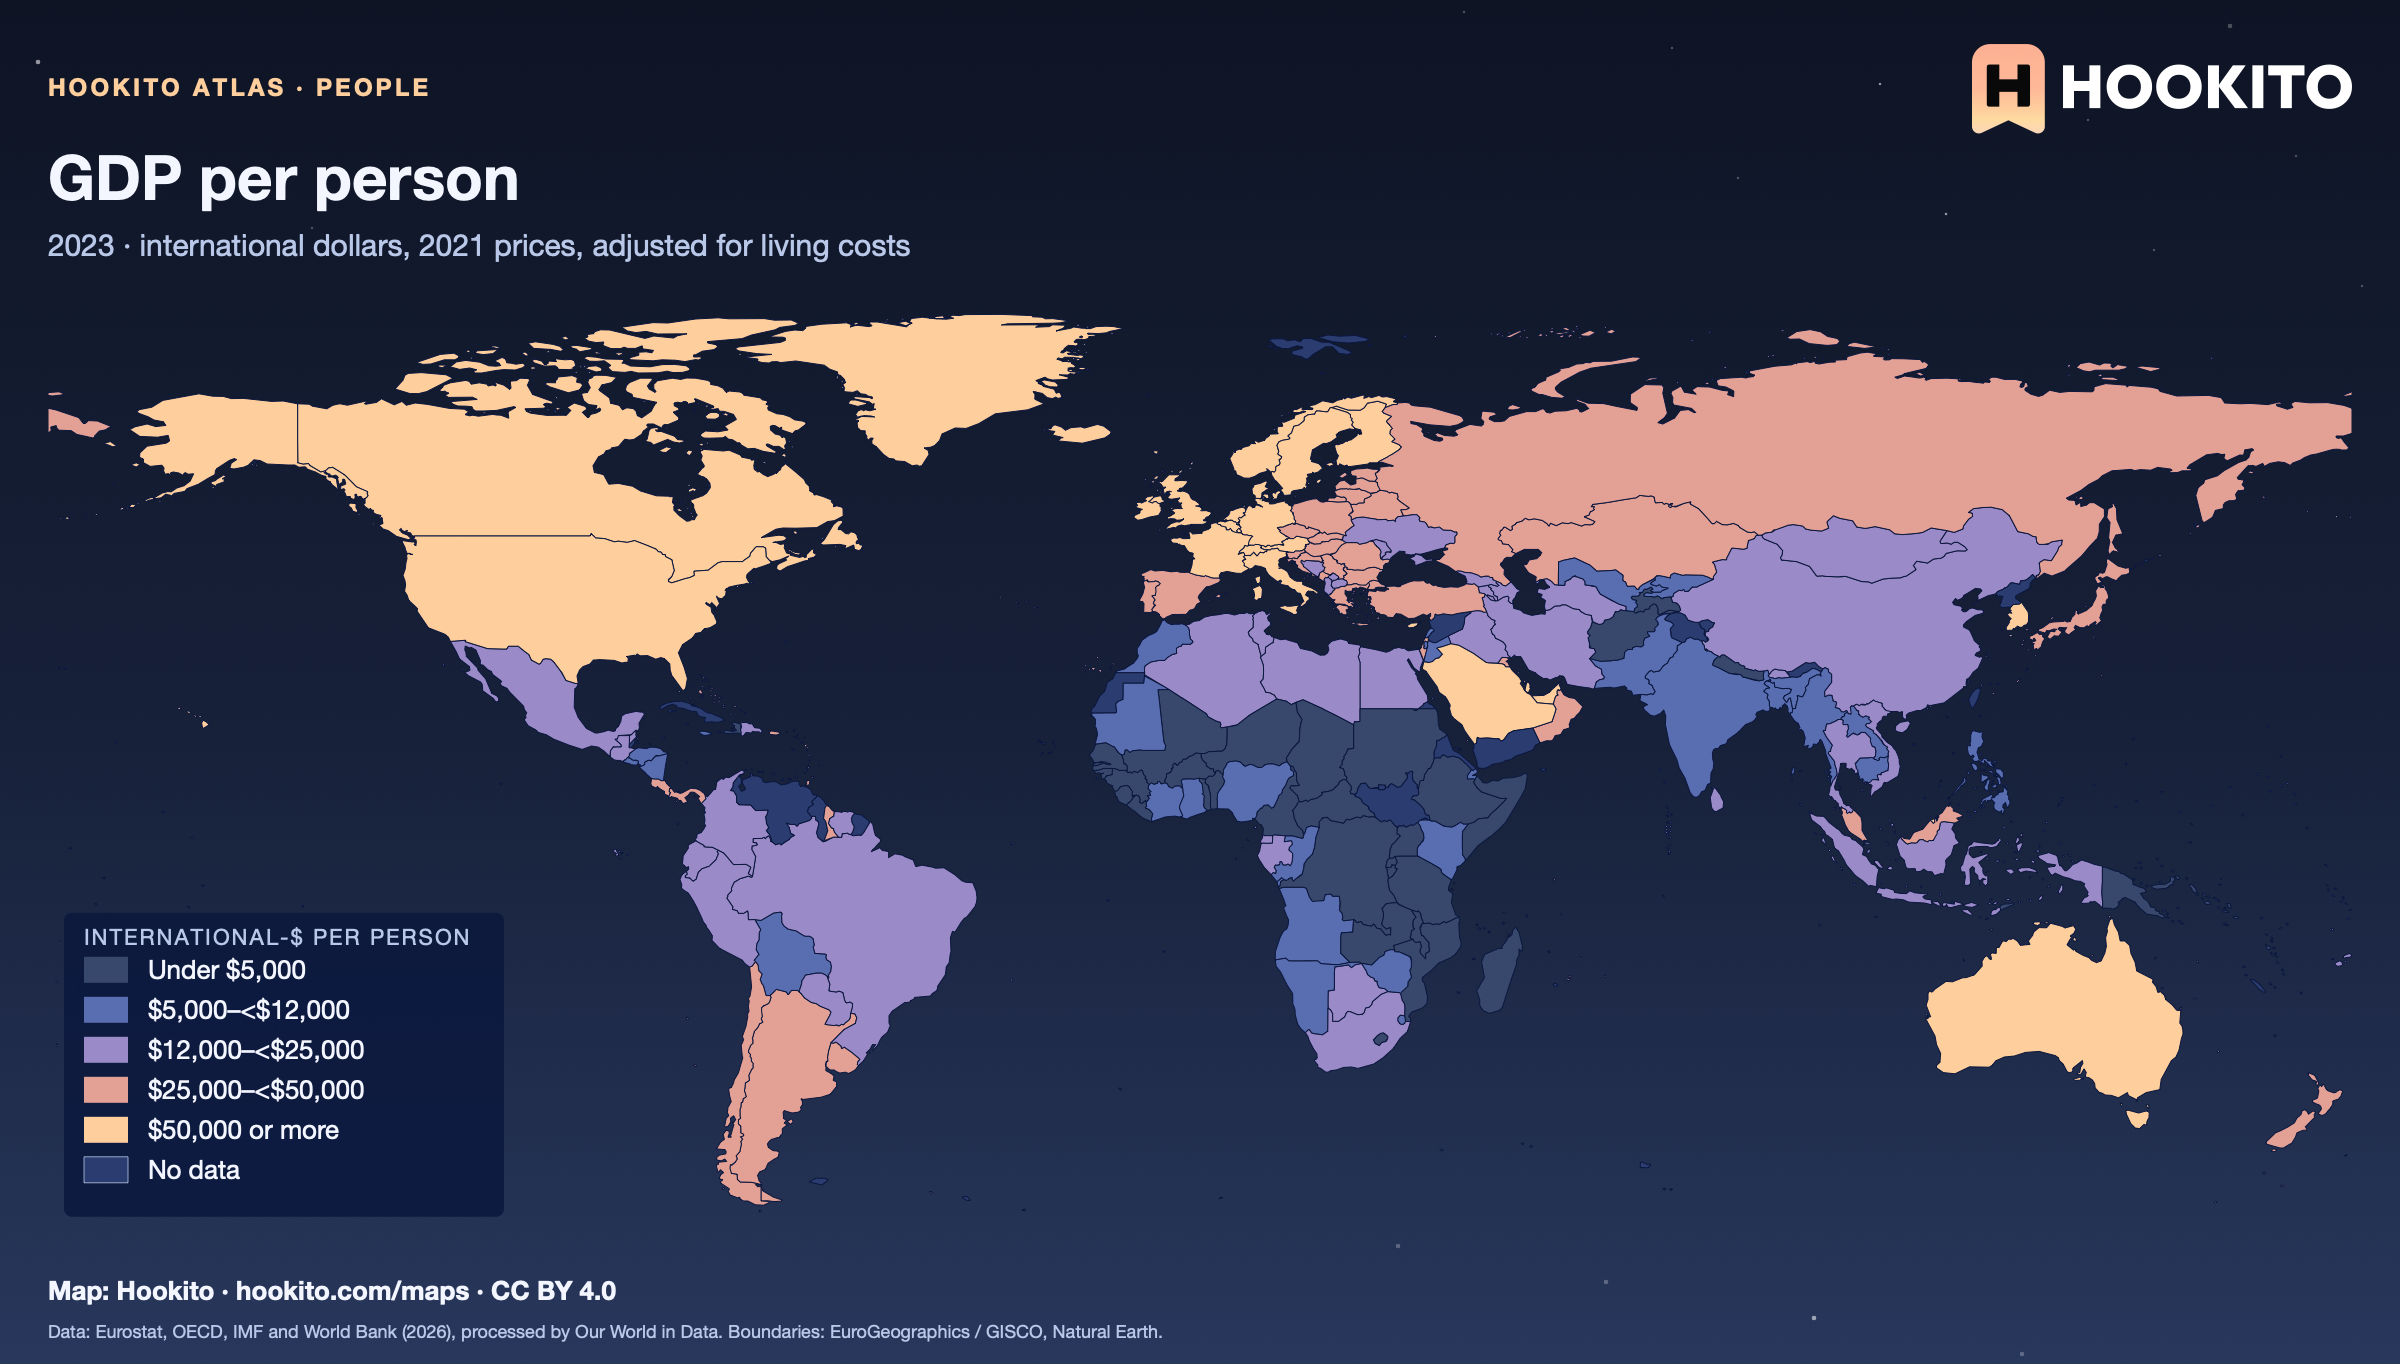
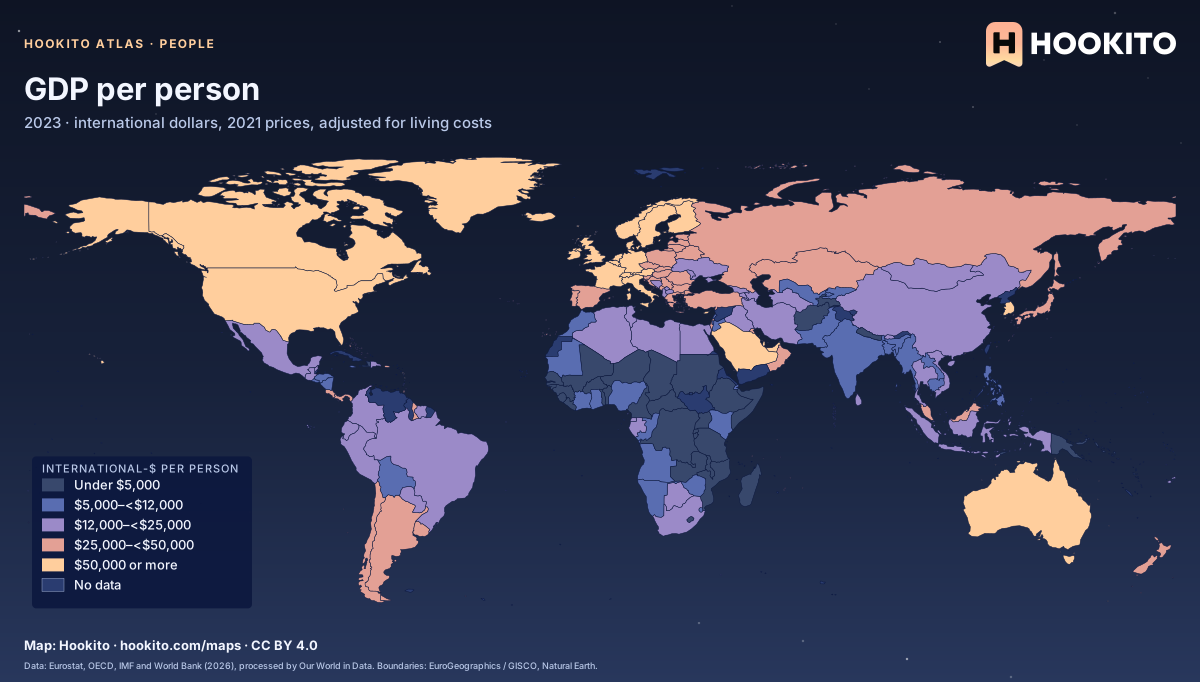
GDP per person

GDP per person, world map with five colour bands and missing data.

Gross domestic product divided by population, adjusted for inflation and for differences in living costs between countries. It is an average and does not show how income is shared. Grey-blue indicates no data. Source details and reuse terms: https://ourworldindata.org/grapher/gdp-per-capita-worldbank.

Embed this map

Data: Eurostat, OECD, IMF, and World Bank (2026), via Our World in Data (https://ourworldindata.org/grapher/gdp-per-capita-worldbank). Administrative boundaries © EuroGeographics (Eurostat GISCO). Additional boundaries: Natural Earth (public domain). Source data and citation ↗

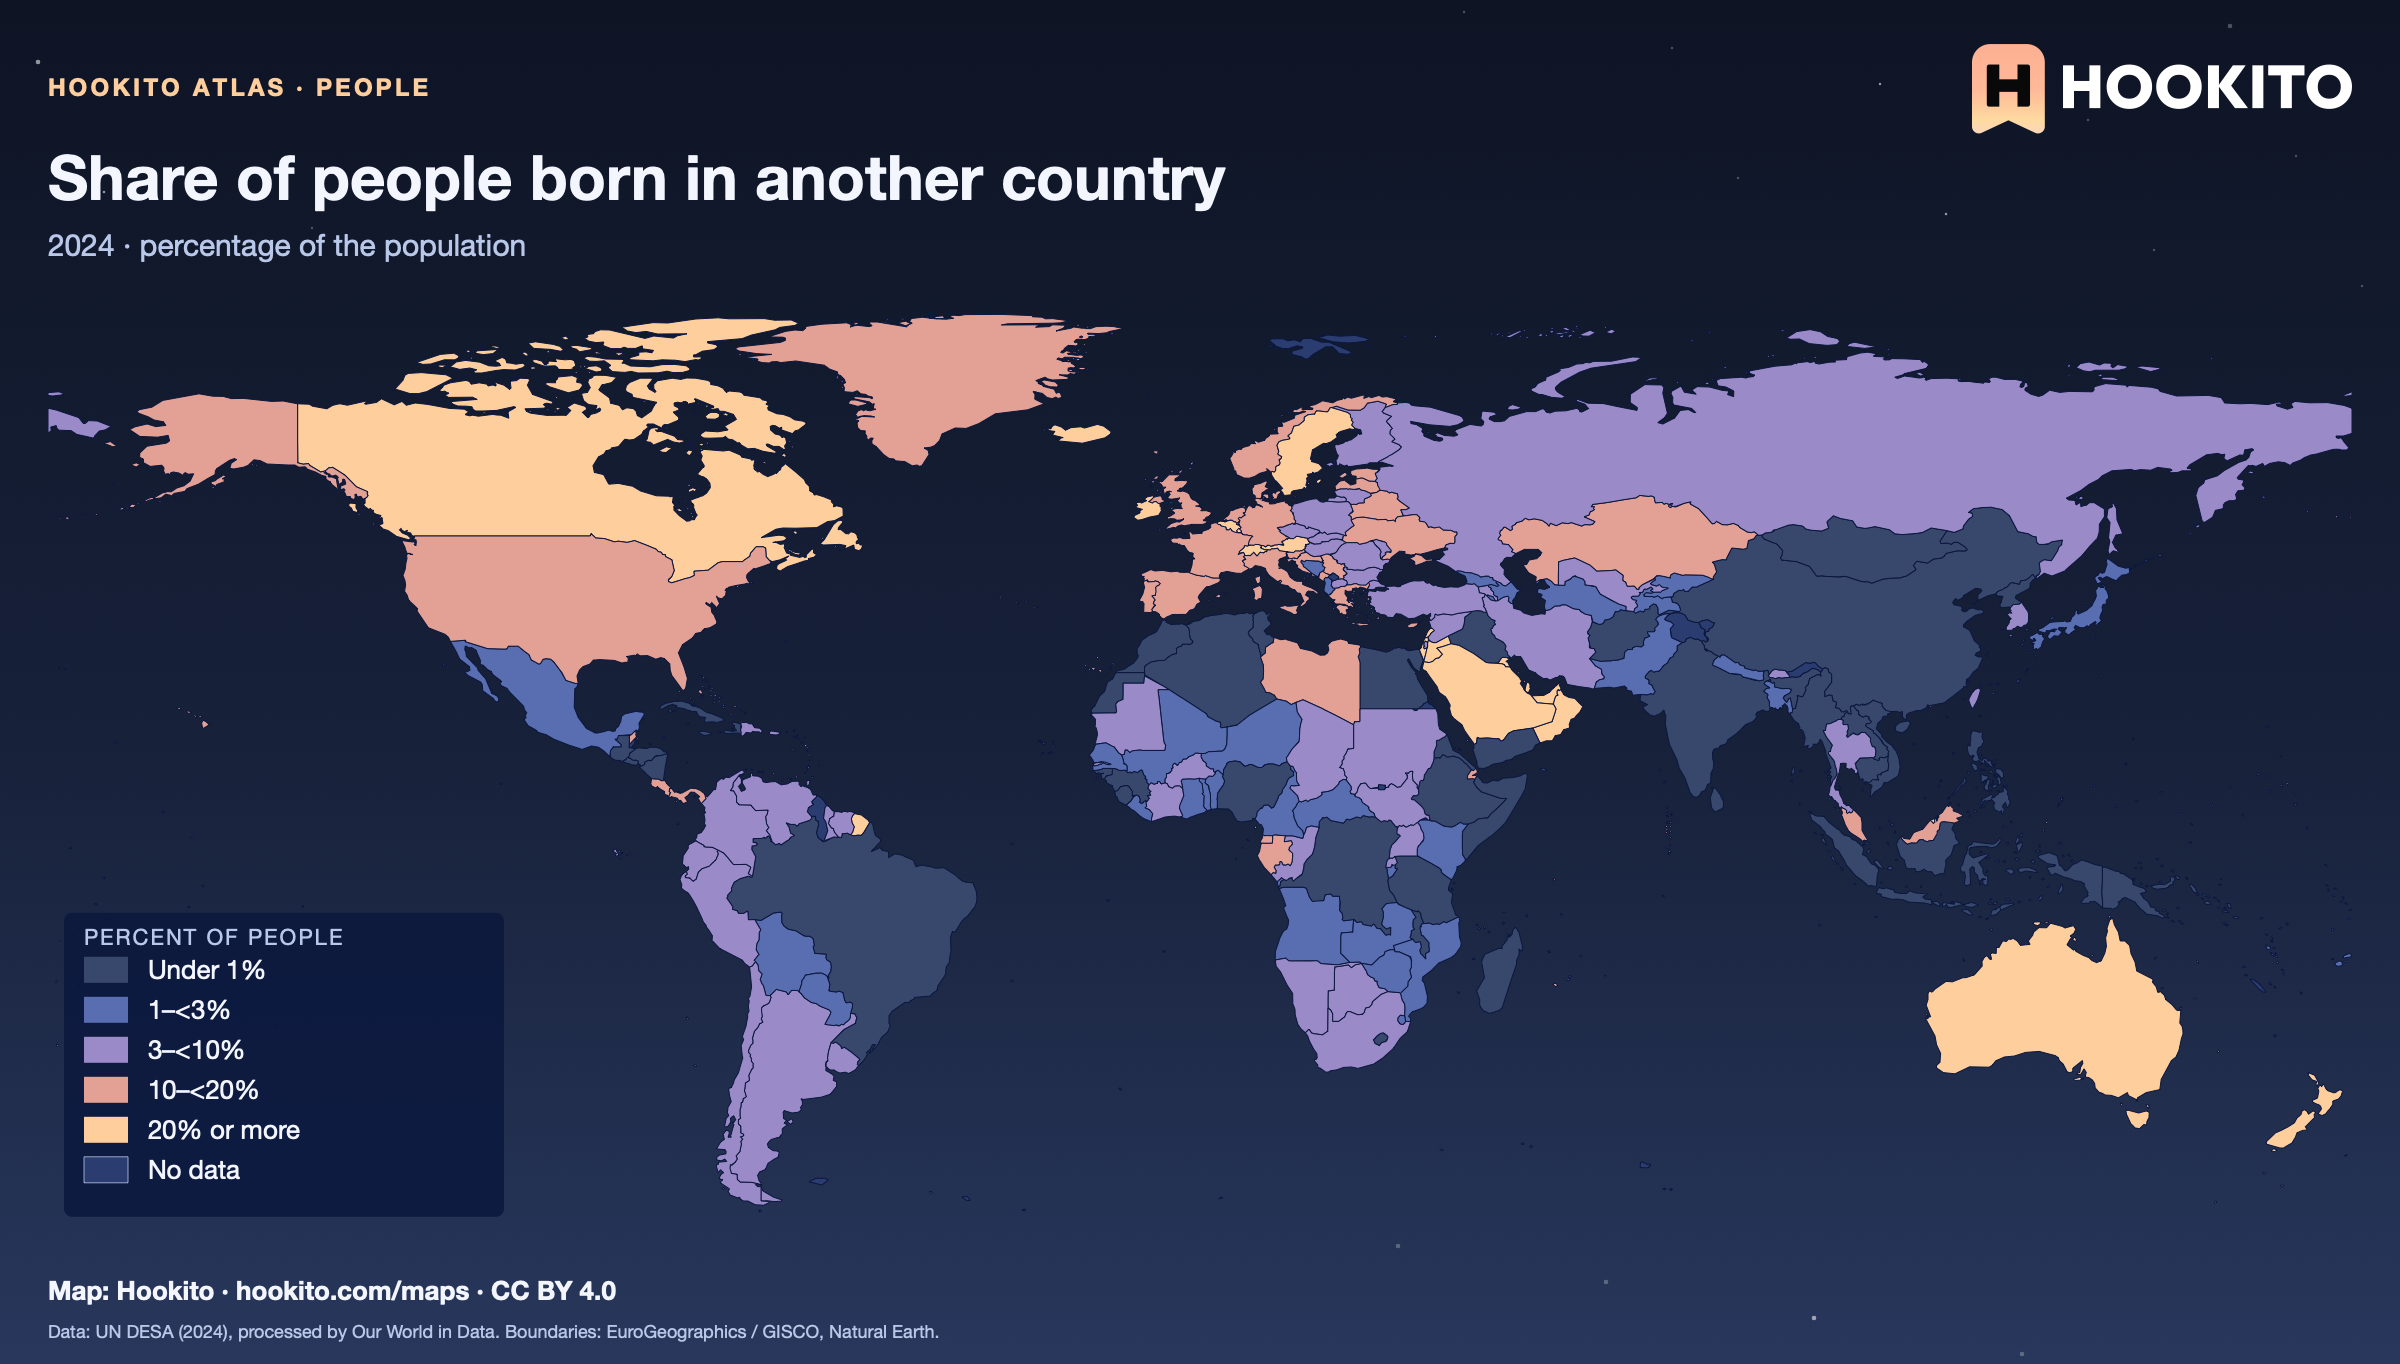
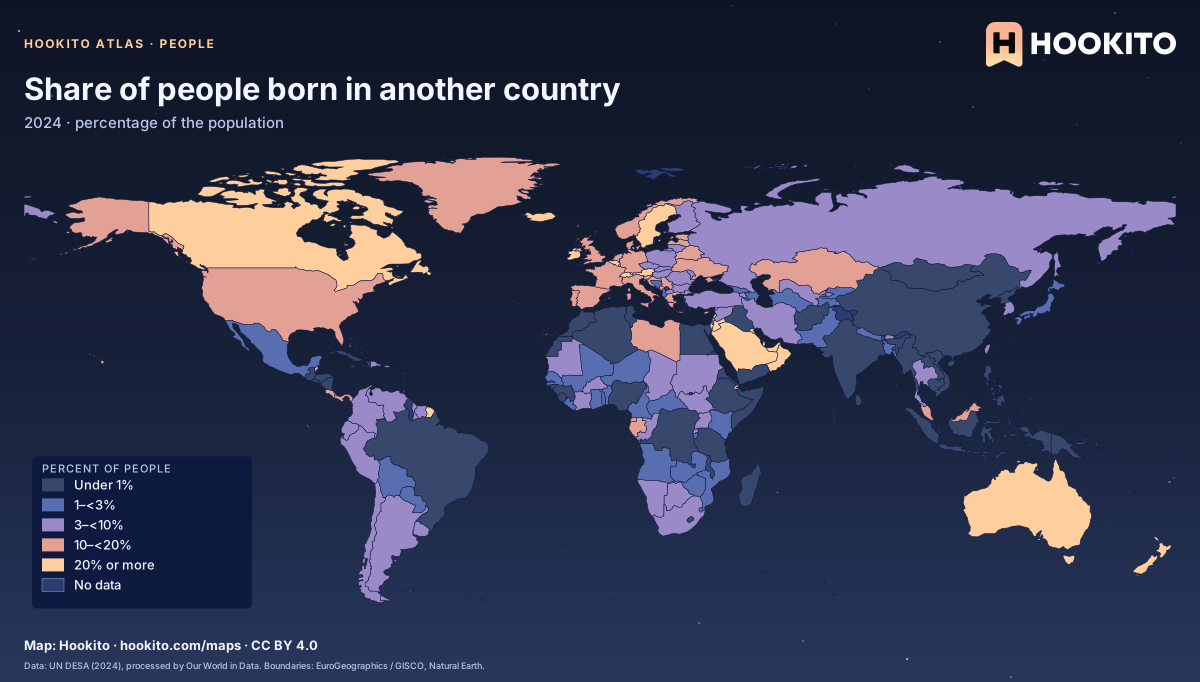
Share of people born in another country

Share of people born in another country, world map with five colour bands and missing data.

People living in a country other than the one where they were born, including refugees. Very small states and some Gulf states have extreme shares. Figures are for 2024. Grey-blue indicates no data. Source details and reuse terms: https://ourworldindata.org/grapher/migrant-stock-share.

Embed this map

Data: United Nations Department of Economic and Social Affairs (2024), via Our World in Data (https://ourworldindata.org/grapher/migrant-stock-share). Administrative boundaries © EuroGeographics (Eurostat GISCO). Additional boundaries: Natural Earth (public domain). Source data and citation ↗
Reusing the maps

You’re welcome to share, print or adapt these maps. The renderings are licensed CC BY 4.0: credit them as “Map: Hookito, hookito.com”, with a link to this page where you can.

The underlying data keeps its own terms, so keep its credits too. Administrative boundaries © EuroGeographics (Eurostat GISCO), which also applies to most country outlines. Additional boundaries are from Natural Earth (public domain). Each map lists its other sources: Wikidata and GeoNames for country facts, Our World in Data for the statistics, Unicode CLDR and the IANA time zone database for the calendar and clock maps, flag-icons (MIT) for the flags, Wikimedia Commons for the paintings, NASA Earth Observatory for the night imagery. The maps are offered as finished images only; the boundary data itself isn’t available for download here.
Where to next?

Back to the globe
Hookito landscape illustration